
[Excerpt from The Pickett Line January 2025 Issue]
‘Same as it ever was’ we said back in the October 2024 issue, taking our inspiration for that month’s market theme from David Byrne and the Talking Heads. And a few months before that, in the June issue, we looked to Jim Morrison and The Doors to mark the truckload Freight market cycle’s long-awaited Y/Y inflationary break in Q3 2024 with their 1967 hit ‘Break on Through (To the Other Side)’. And now once again in this January 2025 issue, as we ponder the most recent month of market and macro data, the writers here at Pickett Research can’t get another familiar song verse from yet another legendary artist out of their heads. So this month we turn to none other than The Cougar, John J. Mellencamp, and his #1 hit ‘Jack & Diane’ released in 1982. Not because the current freight market in any way reminds us of the wholesome love story of “two American kids growin’ up in the heartland”. But because so much of the story this month is about the increasingly mixed signals we’re seeing in our truckload demand indicators and the uncertainty that is creating as to where spot and contract TL linehaul rates go from here. So rather than stir up some good old-fashioned Midwestern nostalgia with a “Little ditty ‘bout Jack and Diane”, the song’s opening verse, this month we’re going to be unpacking a ‘Little ditty ‘bout Truck-ing De-mand’. We know we’re reaching on this one, but go listen to the tune if you haven’t heard it in a while and you’ll see what we mean.
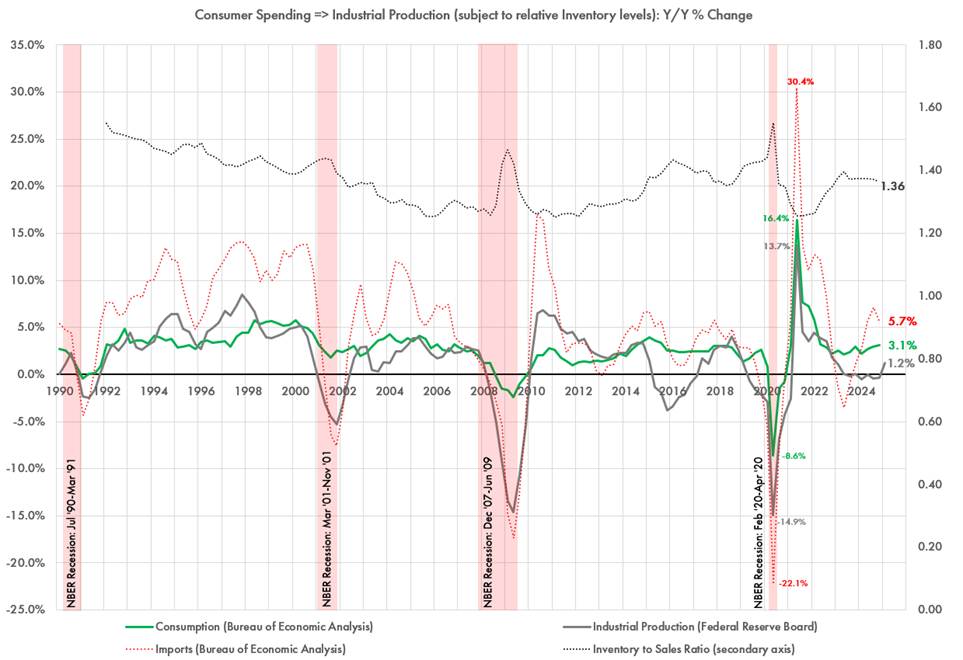
So let’s start with the good news. As we see in our Chart of the Month (new tradition) below, the 1st revision for Q4 2024 Consumption (green line) held up at a constructive +3.1% Y/Y and continues to point up and to the right. In addition, our first glimpse at Q1 2025 Industrial production (gray line) finally showed some life, popping to +1.2% Y/Y and its strongest read in nine quarters. But wait, there’s more! After flat lining at 1.37 for five consecutive quarters, the Inventory to Sales Ratio closed Q4 2024 at 1.36 and its own lowest print in nine quarters. Remember that the lower the ratio goes, the stronger the pull for new inventory and therefore the greater the level of industrial production required to fulfill it. So an all-around bullish read for future truckload capacity demand and the first time in a long time that we’ve seen any real evidence of a potential recovery in US manufacturing. That said, the Industrial Production data was a little noisy beneath the headline index number with gains in Nondurable Consumer Goods driving most of the gain despite weakness in Durables and Automotive. And of course, one month hardly makes a quarter. But constructive nonetheless.
With a chart pattern like that, we would have expected to see the strong early Q1 strength in US TL spot linehaul rates to hold up much better than it did. After posting a hotter than expected preliminary Q1 2025 read of +8.9% Y/Y vs. a forecast +15.0% + 5% last month, seasonality showed up with a vengeance in February and took our US TL Spot Linehaul Index all the way down to +4.8% Y/Y now two thirds of the way through the quarter and putting our forecast even further out of reach. But perhaps it wasn’t all seasonality. We also got a preliminary Q1 2025 January print on the Cass Shipments Index, one of the primary indicators we use to gauge TL capacity demand in the marketplace, of -12.4% Y/Y – the lowest read since Q2 2020. We suspect that some especially gnarly winter weather across much of the US throughout the month of January was partially to blame for the hot start for TL spot rates. So it would be reasonable to assume that same weather may have also been a contributor to the relative collapse in Cass shipment volume – another case of ‘what giveth shall also taketh away’. And it is when trying to square this glaring divergence between Q1 2025 Cass shipments and Q4 2024 Industrial Production, Consumption, and the Inventory to Sales ratio that Mr. Mellencamp’s seminal work repeatedly comes to mind. So settle in, maybe over a “chili dog outside the Tastee Freez” (look it up), as we unpack a ‘little ditty ‘bout truck-ing de-mand’ in this special January 2025 issue of The Pickett Line.
So here we sit. After an unusually inflationary January where spot market rates shrugged off typical seasonality and ran materially hotter than December, we’re now into the first week of March where conditions have continued to cool in line with the season. And given we still don’t really know how much of January’s rate action was driven by the cycle market recovery in progress vs. that series of disruptive winter storms, the month ahead should be telling. At this point, we have gotten every bit of the 10-20 cent per mile retreat in spot linehaul van and reefer rates that we typically see when capacity returns to the market after the holidays – it just came three weeks later this year. If the market finds a local bottom here before making a slow turn to run higher through March to close the quarter, then we believe the current Q1 forecast for spot linehaul rates to reach the low end of the +15.0% Y/Y + 5.0% forecast range remains within reach. Though, even that feels like a bit of a stretch at this point. But if we somehow get a repeat of last year’s St. Valentine’s Day spot market massacre where spot rates ran steadily lower through the end of April before finally hitting bottom, then the forecast curve will almost certainly get pushed forward by another quarter in next month’s issue thus further delaying the next cycle peak to mid-2026.
But absent another massacre, where do we likely go from here? Recall that after breaking on through (to the other side) in the June issue with a very preliminary Q3 read of +3.0% Y/Y, we went on to close the quarter at a weaker but still inflationary +0.6% Y/Y, thus finally getting the closure we had been waiting and completing Cycle Five on the Pickett Research freight cycle timeline and setting up our now current Cycle Six. That meant we finally exited the longest observed market cycle on record (albeit a relatively short record at 18 years) at 16 quarters (Q3 2020 – Q2 2024) vs. the typical 13-14 quarter cycles that came before. From there, our final Q4 print on the US TL Linehaul Spot Index showed us indeed holding trend at +5.5% vs. a forecast of +7.5% + 5%. And now two thirds of the way through Q1 2025, we’ve got a revised February mark of +4.8% Y/Y vs. a forecast +15.0% + 5% taking us conspicuously off-pattern and pointing lower not higher vs. Q4. This makes the month ahead all that more interesting. While the short-term trend remains sequentially deflationary in line with typical seasonality, we do expect to close the quarter at least somewhat higher from current levels. Should that be the case and the current cycle forecast remains intact, the only real question for everyone will continue to be: “Ready to go again?” What we can’t predict yet with any real certainty is the pace and the magnitude of the inflationary journey ahead of us, especially now given the recent divergence in those pesky “truck-ing de-mand” indicators.
Despite this recent pullback, for the Shippers and Brokers on the buy-side of the market as we noted in recent months, while the specter of the inevitable inflationary leg of the next freight rate cycle over recent quarters was often characterized as ‘Winter is Coming’, the motto of House Stark in Game of Thrones, that is clearly no longer the case. Winter has arrived. It’s here. And just like House Stark, where the motto was often used as a reminder of their responsibility to prepare for the challenges ahead, the Shippers that did just that will be positioned to outperform those that didn’t in the year ahead. And with winter now here, the freight rate recession in the rearview mirror, and the new US Spot TL Linehaul Rate Cycle (6) well underway, that can only mean one thing for the supply-siders still standing: ‘It’s time to make some hay’. However, with seasonality back and much of the early January froth now blown off the spot market, the harvest season will no doubt be volatile.
So what does the current market trajectory mean with regard to expected market behavior? How are buyers and sellers likely to act? Who is preparing for winter and what does that even mean? As noted in recent issues and summarized again here for any new subscribers, with the projected spot market cycle bottom now in (though re-tested in April), many enterprise procurement teams have logically looked to extend the duration of their contracts to try and ‘lock rates in at the bottom’ – which never really works over the long term yet represents a short-term temptation that is often difficult to resist. We estimate that through the duration of the most recent inflationary leg of the rate cycle from Q3 2020 to Q1 2022, TL spot linehaul rates ran at an +18.1% premium (or penalty if you’re on the buy-side) to contract rates – with the first two quarters representing the worst of it at +20-23%. This compares to an average premium/penalty of +10.4% during the last inflationary leg before that (Q2 2017 to Q4 2018), so cycle amplitudes have clearly increased.
We also can’t ignore the COVID-driven boom in the demand for goods that helped rally the 2020-22 leg, but to what extent we’ll never really know for sure. In other words, it appears that the US TL spot market is getting more volatile, not less. Therefore, spot vs. contract linehaul premiums could easily exceed +15-20% by late 2025. And when we put it this way, who could blame procurement teams for seeking to extend contract terms? It’s just a matter of whether the suppliers on the other side of those agreements will ultimately honor them over the entire term – which will at least somewhat be driven by the shippers’ own behavior over this recent record cycle trough. More specifically, if they went out and re-bid what had previously been characterized as contract awards prior to the end of the contract term, they effectively signaled to their supply base that it is entirely acceptable to give back contract freight prior to the end of the contract term if it suits them. So it goes both ways.
That means we should continue to see what used to be shorter-term quarterly or six-month bids increasingly transform into one- or even two-year commitments when the time comes to renew. But by mid-year if not sooner, we should also look for many of them to unravel as primary tender acceptance rates start to fall back to 2020-21 levels. That said, all is not lost if you are one of those procurement teams that run this playbook, usually under duress from a finance organization or executive leadership team looking to drive operating costs lower by any means necessary. You’ll just need to be especially agile as the freight market landscape shifts in the quarters ahead. To that end, if you haven’t done so already, we recommend that you invest in the technology and tools required to give your team the visibility and control they need to track the performance of your contract lanes and carrier partners on at least a weekly basis, and then be in a position to take decisive action if necessary – from rebidding lanes away from underperforming vendors to procuring surplus backup capacity at rates likely to be more attractive than what you’ll find in the spot market when you need them, to leveraging more dynamic contracts that adjust more frequently based on market indices or benchmarks. If you’re unable to position for long-term performance to begin with because global procurement best practices dictate otherwise, the next best thing is to build the operational flexibility to course correct and adapt before your competitors do as the economy and market evolve and the freight cycle marches on.
Now on to the January macro update, where most of our primary indicators again managed to show steady improvement vs. prior period – including the revised read on Q4 Consumption and preliminary Q1 2025 Industrial Production as noted earlier. Will the relative strength signaled in recent prints hold up or is this yet another macroeconomic head fake? Just where does the latest installment in our most recent dramatic narrative aptly titled ‘Consumption vs. Industrial Production: Which is telling the truth?’ take us? And do we have a new storyline brewing with the recent divergence in truckload capacity demand indicators?
Recall that the big news way back in October 2023 was a preliminary Q3 2023 Consumption read of +2.2% Y/Y, which was decisively higher than Q2’s +1.8%. Our guidance at the time was that if this trajectory holds over the next quarter or two, it would signal that a recession in 2024 was unlikely – at least according to patterns observed over the last fifty years. That didn’t mean it couldn’t happen, just that historical precedence suggests otherwise. Then with the final revision closing the quarter at +2.4% Y/Y, it became official and was only reinforced by Q4 2023’s +3.0%. But would the uptrend stand, we wondered? Or would Q1 2024 tip us in the other direction? With Q1 closing at +2.2% Y/Y, while slightly lower than Q4 2023, we remained mostly pointed up and to the right. Though, given the recent relative weakness in labor markets and retail sales at the time, the US economy was hardly out of the woods. And much still had to go right to stick that soft landing that Jay Powell and the Fed had been doggedly pursuing. But with Q2 2024 hitting the board at a materially higher +2.7% Y/Y, Q3 at +3.0% Y/Y, and now a revised Q4 flashing a still higher +3.1% Y/Y we see the case for that soft landing looking pretty good.
But how constructive are these recent Consumption prints, really? Was all of the strength in the Services segment at the expense of Goods consumption driven by a material reallocation of post-COVID spending, as many of those same economists and market pundits have suggested? Just as we did last with last quarter’s mark, let’s take a look under the hood to find out. Recall that in Q4 2023 we found that both Durable and Nondurable Goods consumption surged materially higher while Services remained flat, contradicting the prevailing narrative around the reallocation of consumer spending from Goods to Services. In Q1 2024 however, we finally saw signs of a potential reversal in trend with Goods turning over sharply while Services started to show more life. Durables slowed all the way down to +1.2% Y/Y and Nondurables to +1.6% Y/Y. Services, on the other hand, moved slightly higher to +2.5% Y/Y where it had remained mostly range-bound between +2-3% over the prior seven quarters.
Up to that point, it had appeared that the demise of Goods consumption (relative to Services) had been greatly exaggerated. But if these more recent trends held through upcoming revisions, it would make for a pretty strong signal that consumer appetite for durable goods was finally waning in the face of a raft of macroeconomic headwinds including compounding inflation, a cooling labor market, and high interest rates. This tracks with recent headlines suggesting that consumers were increasingly putting off the purchase of big-ticket items like appliances, furniture, and automobiles but we would have to wait to see a couple more months of data before drawing any real conclusions. With revised Q4 2024 data now in, the strength signaled in last quarter’s read remains though is concentrated mostly in Durables. Durable Goods consumption has surged higher to +5.7% Y/Y vs. +3.5% in the prior quarter and +2.6% in Q2 with Nondurable Goods flattish to down slightly to +2.1% Y/Y vs. +2.2% in the prior quarter and +1.9% in Q2 and Services flat at +3.1% Y/Y vs. +3.1% in the prior quarter and +2.9% in Q2.
Given the relatively higher freight intensity required to satisfy the demand for physical Goods, a sustained recovery in Durable and Nondurable Goods consumption is clearly a bullish signal for future truckload capacity demand. As finished goods inventory is depleted over time, wholesale replenishment orders get triggered more frequently. If sustained, this drives factory orders higher which then requires increased levels of industrial activity to fulfill those orders and replenish wholesale and retail inventories to satisfy future demand. And US truckload capacity is likely going to be needed to move those goods through just about every link in that chain – even more so if more of that production happens in North America as opposed to overseas. But with Goods consumption mostly accelerating higher through Q4 2024, the consumption of Services had remained conspicuously flat from a Y/Y rate of change perspective. So while the argument for consumers reallocating their spending from Goods to Services in a post-COVID economy is logical and often used to help explain the strength or weakness in specific industries like the airlines or global logistics services, there was little evidence in the GDP and Consumption data suggesting that’s what had really been happening – at least not until that Q1 2024 print. But with subsequent prints sharply reversing that relative weakness in Durable Goods consumption, the question remains whether Q1 2024 represented any version of a change in trend or will data points stay on a more constructive trajectory in the months and quarters ahead as the economy seeks to stabilize and Federal Reserve monetary policy likely transitions to expansionary. With our revised Q4 2024 print remaining flat at +5.7% Y/Y, we’re just about all the way back to Q4 2023’s +5.8% Y/Y before taking that Q1 2024 dive.
Now with the protagonist of our story, Consumption, continuing to make its case that US Consumers remain mostly resilient and that ongoing relative weakness in Industrial Production is unlikely to last, let’s check in with our villain for the time being – Industrial Production (IP) itself. While our dramatic yet corny ‘Consumption vs. Industrial Production: Which is telling the truth?’ storyline got another jolt last month with preliminary Q4 2024 Consumption hitting the board at +3.2% Y/Y and up 20 bps vs. Q3, it remained largely unresolved as we hoped for a little more signal strength in the Q2-Q4 2024 reads on Industrial Production. Coming off a final Q3 2024 read of -0.4% Y/Y, our final Q4 print came in at a slightly stronger but still weak -0.2% Y/Y. So no sign of a meaningful recovery in industrial activity just yet, at least nothing that showed up in the IP data. But we got just that with the January Industrial Production index posting a preliminary Q1 2024 read of +1.2% Y/Y – again as noted earlier. So with Q4 Consumption pointing still higher and Industrial Production finally signaling that it could be ready to close the distance between the two, we score this one clearly in favor of Consumption in the ‘Which is telling the truth?’ contest. But the tension only builds as we are forced to remain perched on the edge of our seats for yet another month to see how much of this remains confirmed. So stay tuned for next month’s issue where we get a second look at Q1 2025 Industrial Production and the final revision of Q4 2024 Consumption to see where they take us as the saga continues. Believe us, we’re just as anxious to get to the end of this saga as you are.
One of the places we also continue to look for more signal is in relative inventory levels, where an accelerating Inventory-to-Sales Ratio is bearish for Industrial Production and a decelerating ratio tends to be bullish. Recall that, after closing Q1 2023 at 1.38, Q2 took us slightly higher to 1.40 thus signaling that a local peak had yet to be reached and more inventory would have to bleed out of the system before we should expect any meaningful recovery in Industrial Production. When Q3 2023 closed at 1.37 and stayed there through Q4 and then Q1 2024 and still again in Q2, we got a little more signal that Q2 2023 may indeed represent that peak which would be strong confirmation that the fragile stabilization and eventual recovery in Industrial Production is likely to be sustained. This argument was only strengthened with Q3 2024 once again closing at that same 1.37. Though we noted then that we’d have to see where future prints take us before getting too excited one way or another. But the lack of any real directional action on this indicator did make sense given what we’ve seen from Industrial Production over the same period. Recall that we then got two somewhat constructive signals in the October print. Not only did preliminary Q4 hit the board at a slightly lower 1.37 vs. the prior month’s 1.38, the September revision took Q3 back down to 1.37 as well – making it the 5th consecutive quarter at that level. Geez, talk about stagnation. But with the final Q4 2024 print on the board at a slightly lower 1.36, we finally have some signal that surplus inventory is starting to burn off thus clearing the way for a recovery in industrial activity and ultimately truckload capacity demand. We noted last month that we “only hope that when IP does finally break, it breaks to the upside as opposed to the other direction – and the opposite for inventory-to-sales”. With this month’s update, that’s exactly what has started to happen. Whether it continues, however, is a topic for next month’s issue.
As we all know by now, the inventory-to-sales ratio historically runs inverse to Industrial Production – which makes sense as bloated inventory levels diminish the need to make more stuff to restock shelves. That means once we finally do observe a local top in the inventory-to-sales ratio, we should expect to see a local bottom in IP – and vice versa. So if a downward trajectory is sustained in the quarters ahead, it would represent an increasingly constructive signal for industrial activity, the demand for TL capacity, and the economy as a whole.
With recent Consumption, Industrial Production, and relative inventory levels all aligned and flashing constructive signals for the first time in two years, let’s turn to our primary TL demand indicators – the Cass Shipments Index, one of the stars of this month’s issue, and the ATA TL Volume Index. Through most of 2023 and into Q1 2024, our chart patterns continued to post mostly Y/Y deflationary and pointing lower. However, from there, we’ve gotten consistent signs of life. After closing Q4 2023 flat to the prior quarter at -8.6% Y/Y, the Cass Shipments Index appeared as though it had finally found a deflationary bottom – which was confirmed with Q1 2024’s -5.2%, Q2’s -5.3% Y/Y and Q3’s -2.8% Y/Y. And while Q4 2024 closed sequentially lower at -3.2% Y/Y, we remained well over Q4 2023’s -8.6% Y/Y inflection point – so the recovery continued. But with the preliminary Q1 2025 print now on the board at -12.4% Y/Y and the lowest read in five years, that all changed. As we often note, one month hardly makes a quarter. It’s entirely possible that the January read was a weather-dampened anomaly and not representative of the quarter, but we won’t know for sure for two more months. Until then, we remain cautious not to overreact one way or the other. But if we do somehow trend down at this level going forward, the fundamental shape of this current Y/Y inflationary leg of the new TL spot linehaul rate market cycle will be back in question.
Our ATA TL Volume Index had followed a similar pattern as it tried to navigate its own cycle inflection. When our final revision for Q2 2024 hit the board at -2.9% Y/Y vs. Q1’s -5.2%, we got strong signal that TL capacity demand may have found a floor and was poised to improve in the months and quarters ahead. But with the final Q3 print on the board at a slightly lower -3.3% Y/Y, that signal got a whole lot weaker. Then our final revision of Q4 hit the board all the way up at -1.4% Y/Y and we were back on track with this TL capacity demand indicator as well. At least we were until this quarter and a preliminary Q1 2025 print of -1.6% Y/Y – 20 bps lower than prior quarter. While not nearly the order of magnitude lower we saw in the Cass Shipments Index, it was lower nonetheless. Should the current trajectory (lower) for both hold up through subsequent revisions, we’ll get a chart pattern that would appear to contradict the current forecast for increasingly higher US TL spot linehaul rates the further we get into 2025. Suffice it to say, we’ll be paying close attention. Readers can expect this development to become a headline in subsequent issues – at least until a remotely consistent trajectory is established.
Now let’s shift our attention to the supply side and Net Class 8 US Tractor Orders where we got another negative signal with our first glimpse at Q3 2024 coming in at -43.6% Y/Y before revising only slightly higher last month to -36.8% – the weakest print since Q2 2022 and once again entirely out of sync with what we would expect at this stage of the US Spot Linehaul TL Rate Cycle. But with September showing the highest rate of order activity this year, our final Q3 2024 read revised all of the way up to -11.1% Y/Y – still deflationary but much less conspicuously out of phase with the US Spot TL Linehaul Index curve as compared to past cycles. However, with the final Q4 print now on the board at +3.4% Y/Y and a preliminary Q1 2025 mark of +4.9% Y/Y we’re back above the x-axis and arguably back on track. Though we’ll have to wait to see how Q1 develops before getting too excited one way or another.
Recall that just when we thought we were back to historic cycle patterns in 2022, which meant increasingly Y/Y deflationary order activity through 2022-23 as the US TL Spot market worked through its own excesses, we got a rocket ship of a number (relatively speaking) in Q4 2022 at +86.5% – thus forming a pattern completely unprecedented relative to past cycles. At the time, we noted that this wasn’t entirely unexpected. Back then, we suggested that the unprecedented disruption in tractor OEM supply chains had created enough of a market distortion that the cycle correlations perhaps got nudged a couple of quarters out of phase. And if so, perhaps we would see Class 8 net orders go Y/Y inflationary with the same two-to-three quarter head start that they led deflationary beginning in late 2021. But as the subsequent quarter closed flat Y/Y and with Q2 closing at a still lower -8.0% Y/Y, we were back in line with historic patterns – albeit somewhat muted. This meant we could take the “2-3 quarter nudge”’ hypothesis back off the table and reframe Q4 2022 as more of a one-off head fake likely driven at least somewhat by OEMs finally opening back up their 2023 order books as their supply chains normalized at a time when plenty of the supply side remained eager to buy. It was a time when much of the market’s frothy enthusiasm from the 2020-21 boom remained despite an increasingly uncertain outlook for the US economy as a whole – which didn’t last for very long. And given the increased weakness reflected in reported quarterly motor carrier earnings performances since Q1 2023, the softness in 2023 net order activity wasn’t surprising.
But with our Q3 2023 read at -23.0% Y/Y, Q4 at -8.6% Y/Y, Q1 2024 closing at +13.6% Y/Y, and Q2 at +22.8% Y/Y, the trendline was back roughly to where we would expect it to be given where we are in the US Spot TL Linehaul rate cycle and relative to past cycles. From there, as noted in recent months, we expected the reversion to historic patterns to continue which meant Q4 2023 was likely the last Y/Y deflationary tractor order read of the cycle before swinging increasingly Y/Y inflationary with TL Spot Linehaul in the quarters ahead. For that expectation to materialize, however, the September mark would have to come in materially higher than the surprisingly weak initial July and August reads. As outlined above, it did exactly that. But it wasn’t enough to take the quarter all the way to Y/Y inflationary territory as projected. Though with recent prints taking us back to Y/Y inflationary land, it’s possible that this historical correlation could finally be on track to warranting more consideration in the year ahead.
While Net Class 8 Tractor Orders have bounced around over the last two years, the roller coaster in US retail diesel prices over the same period has been arguably even more impactful to US TL market dynamics. After running -19.3% lower over the first half of 2023 ($4.714 to $3.802), we marched +20.0% higher in Q3 ($3.802 to $4.563), then reversed course yet again to fade -13.0% lower in Q4 ($4.563 to $3.972). From there, we faded another -6.3% lower to close June and Q2 at $3.722/gal before once again reversing the trend to move +2.4% higher in July to $3.810/gal. But with Q4 and two thirds of Q1 2025 now behind us, the market has faded another 14 cents lower and now sits at $3.675/gal. While certainly not the whole story, and not withstanding the 16 cent rise over the last two months, this long-term slide in diesel prices over most of the past year has no doubt been one of the factors allowing otherwise unprofitable surplus suppliers to remain active in the spot market – that and some combination of surplus profits generated in 2020-22 and possibly a surge in SBA loans granted under COVID stimulus programs with wildly favorable terms.
To zoom out a bit and further recap diesel’s wild ride for anyone who hasn’t been paying attention, the price of diesel had finally started to correct lower in mid-2022 after exploding steadily higher for much of the year up to that point – from $3.727/gal in January 2022 to $5.754/gal in June before retreating slightly to close September just barely under $5/gal at $4.993. This took the final read on Q3 2022 to +53.8% Y/Y after peaking at +70.7% in Q2. Unfortunately, however, diesel reversed once again to jump +5.0% (+$0.26/gal) higher through November to close at $5.255 on fears of a US diesel shortage driven by diminished refinery capacity in the northeast. Ultimately, those fears proved to be unfounded as diesel instead reversed course once again and ran -27.7% lower to June 2023 at $3.802/gal and a Q2 average of -28.1% Y/Y. But just when we were starting to lose interest, July came along and initiated the reversal in trend that took prices steadily higher through September and $4.563/gal. It proved to be short-lived however, with yet another reversal that looked temporary at the outset but has only picked up steam – with February 2025 coming in at -19.5% from the September 2023 high mark despite brief turns higher in July, October, and the last two months. So with momentum swinging from month to month while 2025 global energy forecasts continue to diverge, it is hard to say where diesel goes from here in the short term especially given the conflicts still raging in the Middle East and Ukraine, disruptions in the Red Sea, and the shifting demand outlooks for both the US and China given new concerns around tariffs, trade policy, and government spending.
As noted in past issues and repeated here for any new readers, the last time we saw anything like 2022’s spike in fuel prices was in 2008 when diesel climbed to +66.6% Y/Y that June – in the throes of The Great Recession. During that particular US TL Spot Linehaul Rate Cycle, unlike this one, diesel spiked higher several quarters ahead of spot and contract rates. As a result, we saw an unprecedented wave of motor carrier bankruptcies and exits as profitability was violently wiped out – especially for those most exposed to the spot market. The key difference this time around is that spot and contract rates led diesel by several quarters, which allowed the market to absorb the diesel shock without forcing carriers out of the market in material numbers at the same rate. And so far at least, it has been a much more gradual exit. As the battle between spot market rates and carrier operating costs rages on, the role that diesel prices have played has been in helping to set the ultimate market bottom where our Y/Y US TL Linehaul Spot Index line finally inflected higher as sufficient surplus capacity has been forced to exit as their operating margins evaporate. And as noted here, we believe we found that bottom with the confirmation of Q1 2023 as our deflationary inflection point. Going forward, diesel’s role remains that of a pacesetter. If prices continue to move higher, then the pace of exits likely continues at the current rate or possibly even accelerates a little. Should they instead reverse course once again fade lower, then the pace of exits likely shows which would be a headwind for TL spot rates and would slow the overall market recovery towards its next Y/Y inflationary peak.
So here we sit with a final Q4 2024 mark of +5.5% and decisively inflationary for the first time since Q1 2022 and a weakening Q1 2025 print of +4.8% Y/Y vs. last month’s preliminary +8.9% Y/Y. Consumption is flashing positive signals while Industrial Production and Relative Inventory also show early signs of finally breaking out of prior patterns to their more constructive upside trajectories. So what’s going to move the needle on Spot TL rates one way or the other in the month ahead? Recall that last month we pointed to our old standbys of diesel prices and TL-intensive goods consumption after taking the risk of a major port strike off the table after a successful negotiation between the ILA and the USMX. As we also noted last month, while we do expect the impact of new Canada, Mexico, and China tariffs that reportedly take effect March 4th to be potentially market-moving should they stick this time, we don’t expect them to be a factor in the month ahead of us.
Looking back over the last year, the steady march higher in US Spot TL Linehaul rates from April 2024 through the first week of July, the rapid pullback in rates post-July 4th and through September and then move once again higher in October implied that surplus market capacity remained. We had noted then that we would get our first signal in the weeks following the July 4th holiday as the market digested that short-term dislocation and reset at whatever the new short-term rate basis proved to be. If the market corrected materially lower to April/May levels, the signal for market equilibrium would be decidedly weaker. If rates held or corrected only moderately lower, we would read that as a constructive signal that the next inflationary leg of a new rate cycle we were forecasting for the back half of 2024 remained on schedule. Through late September however, that’s exactly what happened as the market retraced all the way back to where it started in early May. And given that level of weakness, we were back to debating the timing around both the prior cycle and the one that lay ahead of us. While we ultimately closed Q3 2024 just a hair above equilibrium at +0.6% Y/Y, our final print for Q4 took us decidedly inflationary to +5.5% Y/Y. But now with a revised Q1 2025 mark of +4.8% Y/Y vs. last month’s +8.9% Y/Y, the path ahead is back in question. While we continue to expect that the US TL Spot Linehaul Rate Cycle indeed stays undefeated, we can’t ignore the recent relative weakness and the “off-pattern” kink we now have on the board for the current quarter. Though we’ll have to see where we close before coming to any conclusions. So with all of that said, let’s break down our slightly shorter list of freight market wild cards for the month ahead.
1. TL-Intensive US Consumer Spending: And consumer spending (as a proxy for future TL capacity demand) is back in pole position after long hiatus. Conditions remain tough to say the least for the average US Consumer, despite ample signal that peak Consumer Price Inflation (CPI) is well behind us after many months of slow yet uneven sequential decline. After correcting all the way from June 2022’s +9.1% Y/Y to June 2023’s +3.0% Y/Y, we have been on a bit of a roller coaster with CPI bouncing along within a channel between +3.1% and +3.7%. But with January 2025 on the board back at +3.0% Y/Y we have come full circle. And with the Price Index for Personal Consumption Expenditures, the Fed’s preferred inflation metric, also fading steadily lower in recent months (+2.5% in January 2025), we are seeing mounting evidence that perhaps this time a < 3.0% CPI environment could potentially stick around. That is certainly what the Fed now believes with the long-awaited change in policy direction for the Fed Funds Rate announced at the September FOMC meeting as they took rates down by 50 basis points, followed by another 25 bps in both November and December before pausing in January.
Over this time, and perhaps against all odds, the US Consumer continues to hang in there, as evidenced by the mostly strong GDP & Consumption prints over the last few quarters. However, big questions remain as to just how long the Consumer can hold up, even with interest rates headed lower, or whether existing cracks will widen given signs of a slowly cooling labor market, rising household debt (albeit at a rapidly slowing Y/Y rate) and delinquency rates, and still tight credit conditions. That said, so long as Consumer spending remains steady, the probability of a soft landing for the economy remains the base case. But in any case, while Consumption had moved to the back burner relative to diesel prices and other market forces in recent months, it’s back to the top spot as we see TL capacity demand dictating the strength of the cyclical recovery from here.
2. Diesel Prices: As noted, now that we’re well beyond our Y/Y US TL market cycle bottom, we believe that diesel prices in the months ahead will help set the pace at which spot market rates continue to recover from here. While prices have been on a bit of a roller coaster ride over the last two years, we suspect that the downtrend we got through the first half of 2023 and again over the last nine months, January and February 2025 notwithstanding, only prolonged our time down here at the bottom of the cycle. The lower that diesel went, the lower the market allowed Spot linehaul rates to go. After declining steadily by an aggregate -27.7% from November 2022 through June 2023, diesel reversed and marched +20.0% higher from there to September 2023 before reversing again to fade -19.5% lower to February 2025’s $3.675/gal. If this mostly downward trend is sustained and we continue to head materially lower, we should expect the pace of carrier exits to stall even further, which would continue to throttle the ultimate recovery in spot rates. Though with the up and down action over the last six months combined with an array of geopolitical catalysts currently in play, the path forward is anyone’s guess – though certainly feels more deflationary than not.
With the prior cycle now firmly in the rearview mirror, we can look back and reflect a bit. While the deflationary leg indeed took us far lower than those that came before (-31.8% Y/Y vs. last cycle’s -19.0%), it also took us two quarters longer than the seven-quarter deflationary leg of the last cycle (Q4 2018-Q2 2020) and the seven-quarter deflationary leg of the cycle before that (Q3 2015-Q1 2017). So, incredibly challenging market conditions for sure for most of those on the supply side, but hardly ‘unprecedented’ or ‘generational’ in nature – even considering the lower low and the longer duration. And if this cycle was more like past cycles than it was different, we should be able to anticipate typical market behavior as this Y/Y deflationary leg slowly but surely came to a close and the Y/Y inflationary leg of the new cycle began – and then recommend how best to position. So as outlined in recent issues and revised here for all of you first-time readers, we recommend some version of the following for both supply-siders and demand-siders as we continue to limp out of the gates of this new cycle.
For motor carriers and brokers operating on the supply side of the market, this likely means keep doing what you’ve been doing over the last year and a half – at least if that means cutting costs, getting leaner, and conditioning your teams to be able to do more with less. While we absolutely see the light at the end of the tunnel with some version of the beginning of a recovery in spot TL linehaul rates already in motion, the market correction is virtually guaranteed to be uneven – with different industries, geographies, and equipment types all evolving at their own pace. Also, as noted last month, while the rate of recovery can look pretty dramatic on our Y/Y cycle charts, the sequential development of the market rates each of us experiences will feel altogether different. For example, even if spot rates found a way to go on to close Y/Y inflationary in Q1 2025 at +15.0% Y/Y as projected, that only represents a +8.9% increase from current levels.
And we don’t expect the contract market to break materially higher for another quarter after that, though our preliminary Q1 TL Contract Linehaul (Cass) Index did break Y/Y inflationary at +0.7% Y/Y for the first time since Q4 2022. But regardless of the ultimate pace at which the market flips Y/Y inflationary over the quarters ahead, there is little downside in remaining disciplined and pursuing operational excellence in whatever it is you do. As you prepare for 2025, the months ahead represent a welcome opportunity to refine your commercial strategy and carefully consider the shippers that you want to partner with going forward into the next cycle. Remember, winter is here! And in this case, that means it’s time to make some hay – whether the sun is shining or not. So hopefully you are choosing wisely, as those who navigate the cycle most successfully over the long run tend to be the ones with the most durable long-term commercial relationships with partners that have earned their trust through both the ups and the downs.
And for shippers on the demand side of the marketplace (and brokers that operate on both sides), our guidance is similar. While the recent Y/Y deflationary leg of the cycle has technically, the months ahead represent a tremendous opportunity to recalibrate your transportation strategy for the Y/Y inflationary leg that has just begun – especially given the recent seasonal pullback in spot linehaul rates. The race to the bottom of the TL market that you have enjoyed up to this point is mostly over, but its lingering impact is almost certainly masking weaknesses and deficiencies that will take a toll later this year if left unaddressed. So now is the time to examine your current and projected freight flows to understand where alternative modes, operating models, and capacity partners could create a comparative advantage – whether it be from cost, speed, utilization, or flexibility – in an inflationary TL market. With the cost of capacity increasingly on the rise, the ‘one step back’ spot market slide over the last few weeks aside, the penalty for waste only increases from here. So, focus on filling your trailers and intermodal boxes, or find a way to only pay for the space you need (the penalty cost for shipping air is going up big time!). And work to eradicate empty miles and excessive dwell times from your networks. Remember that 2025’s winners will be determined by the actions taken now. Aspire to be considered a ‘Shipper of Choice’ throughout the cycle, not just when the financial pressures of an inflationary rate environment force your hand.
From here, we now expect to close Q1 2025 up to +4-5% higher to reach +10.0% Y/Y and to run increasingly inflationary as we kick off the next three-to-four-year US trucking market cycle. We continue to project contract linehaul rates, after breaking Y/Y inflationary this quarter, to run higher through 2025 and into 2026 as primary tender acceptance rates deteriorate, routing guides spring leaks, and freight contracts are reset through a flurry of mini-bids – just like in 2017 and 2020-21. Regardless, we hope that this time around, the industry and its trading partners will have more effective tools at their disposal to make better use of the capacity that already exists in the market (across all modes) such that the supply side won’t be baited into overshooting to the same degree as in cycles past. And that the dramatic volatility of this market can begin to be tamed such that we’re not all doomed to a future defined by higher peaks and lower troughs. But until then, the roller coaster must continue.
So just as all looked to be tracking a year ago for a Q1 2024 that marked the end of a long and painful (if you’re on the supply side) deflationary freight recession coming out of January, the supply side somehow found a lower gear and took US Spot TL Linehaul rates all of the way back to their 2023 lows. The St. Valentine’s Day [Spot Market] Massacre came and went, with rates fading still lower through March and into April before bouncing back in May and June – well below estimated operating costs per mile. In fact, our models show that all-in spot TL rates have been unprofitable for the average US motor carrier since Q2 2023 with recent levels at the lowest we’ve seen since the great recession and financial crisis of 2007-09 – with only moderate improvement in Q1 so far. Then after marching steadily higher through the July 4th holiday, what started as a decidedly Y/Y inflationary Q3 print of +6.0% became +3.0% at the end of July and went on to close at an anemic +0.6%. But with Q4 showing a more decisive +5.5% Y/Y and Q1 last month signaling the momentum to run higher ahead, we said we couldn’t “rule out yet another such head fake indicating further softness ahead. We think the probability for that to unfold is pretty low, but certainly not zero. And the odds certainly increased in recent weeks as seasonality finally returned and spot rates faded 10-15 cents lower from early January highs.” With that weakness continuing, the jury remains out – though the odds for just such a head fake have certainly increased.
But whether this unexpected supply-side resilience can be attributed to the disciplined use of windfall profits earned in 2020-2021 or under-market leases secured over that same period or sweetheart SBA loans granted under COVID stimulus programs, these are not permanent advantages. Eventually, surplus savings are depleted, credit lines are tapped out, lease terms expire and mark to market, and loans must be paid back. And that is what we believe is playing out in the market right now. So while we continue to believe that, at this point in the cycle, the attrition of unprofitable capacity will be enough to tip the market to a state of relative supply scarcity and therefore an increasingly Y/Y inflationary spot linehaul rate environment in the quarters ahead (which appears to be already happening), that alone won’t likely surge rates to the levels seen in last cycle’s Q2 2021 +56% Y/Y peak.
To get there, we will need a material recovery in TL capacity demand and therefore US industrial activity. And that’s what this month’s “little ditty ‘bout truck-ing de-mand” is all about. Can the recent strength in consumption, industrial production, and relative inventory levels be trusted as constructive signals for what might lie ahead? Or is the January Y/Y collapse in the Cass Shipments Index the more reliable indicator? And in either case, what impact will that ultimately have on the shape of this new TL spot linehaul rate cycle? At this point in time and with the data we have in front of us, the path forward certainly feels a lot more benign than past cycles, but we probably could have said the same at the same point of each of those past cycles. And while the next roller coaster ride may not be as stomach-churning as the last one, there is plenty that could happen along the way to change that – from tariffs and trade wars to geopolitics and US government reform. Though whatever may come to pass, we don’t expect the fundamental shape of the cycle to change a whole lot. And now that the inevitable buy-side freight market winter is upon us, even if conditions have eased in recent weeks with seasonality, market conditions should finally support at least some version of a sustained supply-side rate recovery in the quarters ahead.
So let’s cue the final chorus from Mellencamp’s ‘Jack & Diane’:
Oh yeah, life goes on
Long after the thrill of livin’ is gone
Oh yeah, they say life goes on
Long after the thrill of livin’ is gone
Of course, the metaphor here applies to the US TL freight market where the cycle goes on long after the thrill of riding it is gone. And after the grinding march through this most recent Y/Y deflationary leg of the cycle characterized as a freight recession, the thrill is probably long gone for many. But on it goes, nonetheless. Though what goes down almost certainly must come up…before it eventually goes down again. Just a “Little ditty ‘bout truck-ing de-mand…a fragmented American market doin’ the best they can.” Cheers to The Cougar, wonder if this really was always a freight song disguised as a heartland love ballad after all. Onward we go.