
[Excerpt from The Pickett Line March 2025 Issue]
Now a full month into the wildly disruptive US Trade War declared on Liberation Day April 2nd (perhaps a date which will live in global supply chain infamy), the US and China remain deadlocked. And while recent news suggests that negotiations have been initiated, the 125%-145% relative import tariffs currently in place have effectively placed an embargo on trade between the two countries altogether. If last month’s theme was ‘One, Two, Three, Four…Trump declares a trade war!’, we’re now in the ‘Five, Six, Seven, Eight…What’s that mean for the fate of freight?’ stage of the conflict.
Though as we noted last month, even before those ‘Liberation Day’ shots were fired, on-again/off-again US tariffs on Mexico and Canada and declared tariffs on automobiles, steel, and aluminum had begun to shift global supply chains into a state of unprecedented uncertainty where “wait and see” quickly became the consensus strategy. Rather than move to recalibrate production and distribution networks amidst a tariff regime that was changing by the day, why not “wait and see” how it all played out? In the meantime, pull forward imports and accelerate exports ahead of potentially negative reciprocal and retaliatory tariff impacts, and pause all major capital investment decisions until clarity is restored. At the same time, many Consumers, spooked by a cooling labor market and the DOGE-ing of the federal government and concerned about inflation spiking due to the new tariffs on the horizon, could begin to rein in discretionary spending. And with the first glimpse at Q1 2025 Consumption and Imports now on the board to compare with Industrial Production and relative inventory levels, circled in our Chart of the Month below, we get to see whether there are any signals in the macro of any of that actually happening over the quarter leading up to Liberation Day. So once again, “let’s go to the videotape” (shout out to Warner Wolf)…
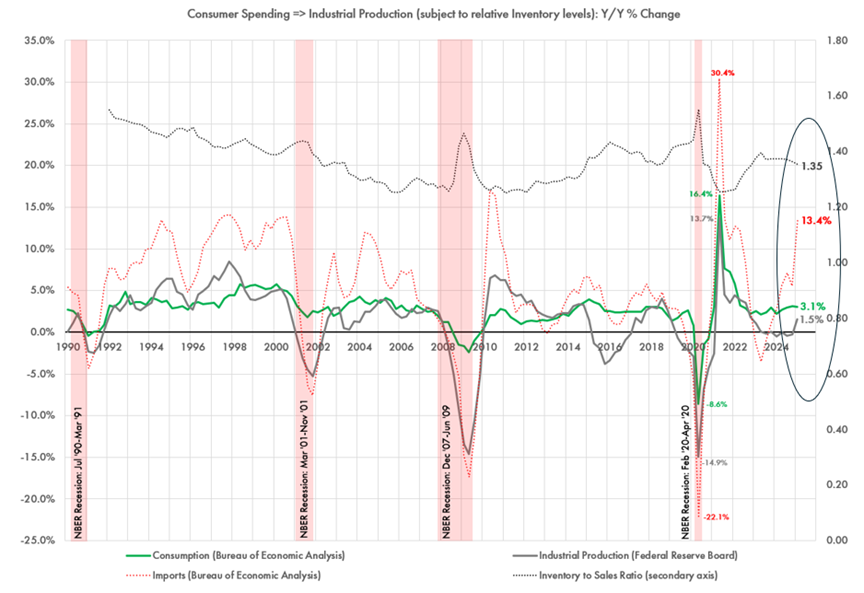
As expected, we see that Imports indeed surged to +13.4% Y/Y and +9.0% vs. Q4 2024 as supply chains presumably pulled forward as much inventory as they could to mitigate future tariff uncertainty. Check. Now onto Consumer spending. Any evidence of a material pullback yet? With Q1 Consumption holding dead flat vs. Q4 at +3.1% Y/Y, the answer is clearly No. While it’s difficult to know with any certainty how much of the relative strength came from Consumers also pulling forward purchases for products expected to rise in price later this year as manufacturers attempt to pass along incremental tariff costs to Customers rather than absorb them fully themselves, it’s reasonable to assume that was at least part of the story. But as it stands, the unexpected resilience of the US Consumer continues.
With the March print on Industrial Production now in as well, we got a Q1 2025 close at +1.5% Y/Y – the strongest read since Q4 2022, confirming what we saw building through January and February. But with the surge in imports, shouldn’t we expect to see at least some level of bloat starting to show up in the Inventory to Sales Ratio? With the February read revising Q1a full 20 bps lower from Q4 to 1.35 and also the lowest (which is positive) print since Q4 2022, we see no such signal yet. If we weren’t in the midst of a historic global trade war and the arguably record levels of volatility and uncertainty that it has created, we would be downright giddy with a chart pattern like this one. You’d have to go all the way back to 2010 when we began the post-Great Recession economic recovery to find a more constructive setup.
It really is quite remarkable, all things considered. But with the Ports of LA/LB currently forecasting a -35% drop in inbound container volume starting next week and no new trade deals officially announced yet, the weeks and months ahead will start the real test as to the net impact of dramatically shifting US trade policy and the first phase of Trump’s Triple Lindy reset of the US economy: (1) Tariffs level the playing field for global trade with the US, generate revenue and incentivize domestic investment, (2) tax cuts mitigate the impact of potential tariff-driven inflation on US citizens, and (3) the DOGE-ing of government spending combined with the incremental tariff revenue covers for the loss of tax revenue. So from this perspective, and the supply chain and truckload market volatility that we expect going forward, this feels an awful lot like “the calm before the storm”. And we unpack it all in this special March 2025 issue of The Pickett Line.
As we outlined last month, we expect some version of the following to unfold in the US trucking market in the quarter ahead, with the timing and severity of such depending entirely on the progress in trade negotiations with China and the rest of the world. Overall volume demand likely shrinks until trade barriers are lifted and/or reshoring activity kicks in to boost domestic industrial production. But of the volume that remains, we’ll see a material reshuffling of trade lanes as supply chains diversify suppliers, end markets, and potentially parts of their production and distribution networks themselves. What had been high-volume predictable contracted lanes will contract with at least some of that volume getting reallocated to new lanes as a result of the reshuffling. Throughout that shift, we likely see an increase in relative volume moving to the spot market as networks struggle to recalibrate – in an order of magnitude we haven’t seen since the onset of government COVID interventions. Remember when the entire food supply chain had to flex as a result of shelter-in-place mandates that shifted consumption entirely to eat-from-home? And entire production lines were converted to instead manufacture PPE, hand sanitizer, and ventilators for overrun hospital wards? We could be in for some version of that as once-stable ‘total landed cost’ models get turned upside down with the impact of these tariffs. And once tariffs are lowered between the US and China, perhaps as soon as the end of May, the surge of containers flooding into previously dormant trade lanes will result in a fundamental disruption to maritime freight flows that will cascade through the ports and inland transportation networks until a new equilibrium is reached – again, just like COVID.
So who gets disrupted the most in this scenario? The short answer is the Shippers and Carriers (across modes and operating models) that lack the flexibility to adapt quickly – often for very good reasons given the capital investment in their networks over the years to drive efficiencies. And while we don’t expect most networks to dramatically shift in the short term (again, “wait and see”), it seems likely that most of them will begin to recalibrate at least a little bit where they see an opportunity to mitigate against tariff exposure. At the same time, we expect the rate of motor carrier exits to accelerate as operating costs increasingly exceed revenues. So while the direct impact of shrinking total volume would logically point to another slide in spot rates, we don’t believe the supply side has any more to give on this front given how unprofitable the spot market already is and the impact of future inflation on their own operating costs – i.e. it’s likely to get worse in the coming months even with spot rates where they already are. So just like we observed back in 2007-2009, while total TL capacity demand is likely going to be under some pressure throughout the duration of the trade war and potential recession (in this case vs. the great financial crisis that time), we believe there is still a strong case for spot rates to continue to grind higher through the end of the year – though have reduced our Q4 2025 forecast from +30% Y/Y to +15% + 5%.
So as we look back at all that has led us to this point, we see an unusually inflationary January where spot market rates shrugged off typical seasonality and ran materially hotter than December, before turning over and tumbling lower through the end of April – the net impact of which is a final Q1 print on the US TL Linehaul Spot Index all the way down at +2.4% Y/Y vs. a forecast of +15.0% + 5.0% and a preliminary Q2 mark of -1.2% Y/Y. Compared to a preliminary mid-January mark of +12.5% Y/Y, this represents a monster of a retreat.
Recall that after breaking on through (to the other side) in the June 2024 issue with a very preliminary Q3 read of +3.0% Y/Y, we went on to close the quarter at a weaker but still inflationary +0.6% Y/Y, thus finally getting the closure we had been waiting and completing Cycle Five on the Pickett Research freight cycle timeline and setting up our now current Cycle Six. That meant we finally exited the longest observed market cycle on record (albeit a relatively short record at 18 years) at 16 quarters (Q3 2020 – Q2 2024) vs. the typical 13-14 quarter cycles that came before. From there, our final Q4 print on the US TL Linehaul Spot Index showed us indeed holding trend at +5.5% vs. a forecast of +7.5% + 5%. And now, with Q2 2025 opening at -1.2%Y/Y, we sit conspicuously off-pattern and now pointing lower not higher vs. Q4. This makes the months ahead all that more interesting. While the short-term trend remains flat to slightly deflationary and in line with typical seasonality, we do expect Q2 to march at least somewhat higher from current levels – though have taken the forecast down materially to +5.0 Y/Y or +5.9% from Q1’s close. Should that be the case and the shape of the long-term cycle remains intact, the only real question for everyone will continue to be: “Ready to go again?” Though compared to the rest of the global economic picture, that may be the least of our worries for the foreseeable future.
Despite this recent pullback, for the Shippers and Brokers on the buy-side of the market as we noted in recent months, while the specter of the inevitable inflationary leg of the next freight rate cycle over recent quarters was often characterized as ‘Winter is Coming’, the motto of House Stark in Game of Thrones, that is clearly no longer the case. Winter has arrived, albeit with a whimper. It’s here. And just like House Stark, where the motto was often used as a reminder of their responsibility to prepare for the challenges ahead, the Shippers that did just that will be positioned to outperform those that didn’t in the year ahead. And will also likely be better prepared to withstand, if not thrive, relative to their competition in the “great supply chain re-calibration” scenario outlined earlier, should that come to pass.
So what does the current market trajectory mean with regard to expected market behavior? How are buyers and sellers likely to act? Who is preparing for winter and what does that even mean? As noted in recent issues and summarized again here for any new subscribers, with the projected spot market cycle bottom now in (and recently re-tested), many enterprise procurement teams have logically looked to extend the duration of their contracts to try and ‘lock rates in at the bottom’ – which never really works over the long term yet represents a short-term temptation that is often difficult to resist. We estimate that through the duration of the most recent inflationary leg of the rate cycle from Q3 2020 to Q1 2022, TL spot linehaul rates ran at an +18.1% premium (or penalty if you’re on the buy-side) to contract rates – with the first two quarters representing the worst of it at +20-23%. This compares to an average premium/penalty of +10.4% during the last inflationary leg before that (Q2 2017 to Q4 2018), so cycle amplitudes have clearly increased.
We also can’t ignore the COVID-driven boom in the demand for goods that helped rally the 2020-22 leg, but to what extent we’ll never really know for sure. In other words, it appears that the US TL spot market is getting more volatile, not less. Therefore, spot vs. contract linehaul premiums could easily exceed +15-20% by 2026. And when we put it this way, who could blame procurement teams for seeking to extend contract terms? It’s just a matter of whether the suppliers on the other side of those agreements will ultimately honor them over the entire term – which will at least somewhat be driven by the shippers’ own behavior over this recent record cycle trough. More specifically, if they went out and re-bid what had previously been characterized as contract awards prior to the end of the contract term, they effectively signaled to their supply base that it is entirely acceptable to give back contract freight prior to the end of the contract term if it suits them. So, as is often the case, it goes both ways.
That means we should continue to see what used to be shorter-term quarterly or six-month bids increasingly transform into one- or even two-year commitments when the time comes to renew. But by the back half of the year if not sooner, we should also look for many of them to unravel as primary tender acceptance rates start to fall back to 2020-21 levels. That said, all is not lost if you are one of those procurement teams that run this playbook, usually under duress from a finance organization or executive leadership team looking to drive operating costs lower by any means necessary – especially as tariffs begin to bite. You’ll just need to be especially agile as the freight market landscape shifts in the quarters ahead. To that end, if you haven’t done so already, we recommend that you invest in the technology and tools required to give your team the visibility and control they need to track the performance of your contract lanes and carrier partners on at least a weekly basis, and then be in a position to take decisive action if necessary – from rebidding lanes away from underperforming vendors to procuring surplus backup capacity at rates likely to be more attractive than what you’ll find in the spot market when you need them, to leveraging more dynamic contracts that adjust more frequently based on market indices or benchmarks.
If you’re unable to position for long-term performance to begin with because global procurement best practices dictate otherwise, the next best thing is to build the operational flexibility to course correct and adapt before your competitors do as the economy and market evolve and the freight cycle marches on. In this regard, if speed is king, pre-planning is queen. As the faster that Shippers and Carriers alike can identify meaningful market or network signals, understand their potential implications, and take action, the better they are likely to perform as we navigate these unprecedented times ahead of us.
Now on to the March macro update, where most of our primary indicators again managed to show steady improvement vs. prior period – including, as we noted at the top, the preliminary print for Q1 Consumption and the March revision to Q1 2025 Industrial Production. Will the relative strength signaled in recent prints hold up or is this yet another macroeconomic head fake as tariff impacts begin to show up in the numbers? Just where does the latest installment in our most recent dramatic narrative aptly titled ‘Consumption vs. Industrial Production: Which is telling the truth?’ take us? And do we have a new storyline brewing with the recent divergence in truckload capacity demand indicators?
Recall that the big news way back in October 2023 was a preliminary Q3 2023 Consumption read of +2.2% Y/Y, which was decisively higher than Q2’s +1.8%. Our guidance at the time was that if this trajectory holds over the next quarter or two, it would signal that a recession in 2024 was unlikely – at least according to patterns observed over the last fifty years. That didn’t mean it couldn’t happen, just that historical precedence suggests otherwise. Then with the final revision closing the quarter at +2.4% Y/Y, it became official and was only reinforced by Q4 2023’s +3.0%. But would the uptrend stand, we wondered? Or would Q1 2024 tip us in the other direction? With Q1 closing at +2.2% Y/Y, while slightly lower than Q4 2023, we remained mostly pointed up and to the right. Though, given the recent relative weakness in labor markets and retail sales at the time, the US economy was hardly out of the woods. And much still had to go right to stick that soft landing that Jay Powell and the Fed had been doggedly pursuing. But with Q2 2024 hitting the board at a materially higher +2.7% Y/Y, Q3 at +3.0% Y/Y, and now a final Q4 coming in at a still higher +3.1% Y/Y we see the case for that soft landing looking pretty good.
At least, that was before April 2nd. From there, consensus forecasts pointed to a much lower Q1 2025 print on GDP and Consumption. We noted last month that “if we do get a sharp move lower, then of course the risk for recession as early as Q3 would increase. But we’ll be heading into that weakness with what had been a relatively strong economy and the momentum in place to hopefully shrug off at least some of the negative market forces we’ve outlined as part of Trump’s Triple Lindy in progress.” But as we saw in our Chart of the Month, while we did technically get a negative Q/Q print on GDP at -0.07%, that was only because of the massive pull forward on Imports and a reduction in government spending. With Q1 2025 Consumption coming in at an unexpectedly solid +3.1% Y/Y, we see no signal yet that points to imminent recession – so long as that strength holds up through the two revisions coming before we get a final print. But as it stands, US Consumers continue to shrug off yet another market headwind – despite all of the doomsday headlines that increasingly dominate the media.
But how constructive are these recent Consumption prints, really? Was all of the strength in the Services segment at the expense of Goods consumption driven by a material reallocation of post-COVID spending, as many of those same economists and market pundits have suggested? Just as we did last with last quarter’s mark, let’s take a look under the hood to find out. Recall that in Q4 2023 we found that both Durable and Nondurable Goods consumption surged materially higher while Services remained flat, contradicting the prevailing narrative around the reallocation of consumer spending from Goods to Services. In Q1 2024 however, we finally saw signs of a potential reversal in trend with Goods turning over sharply while Services started to show more life. Durables slowed all the way down to +1.2% Y/Y and Nondurables to +1.6% Y/Y. Services, on the other hand, moved slightly higher to +2.5% Y/Y where it had remained mostly range-bound between +2-3% over the prior seven quarters.
Up to that point, it had appeared that the demise of Goods consumption (relative to Services) had been greatly exaggerated. But if these more recent trends held through upcoming revisions, it would make for a pretty strong signal that consumer appetite for durable goods was finally waning in the face of a raft of macroeconomic headwinds including compounding inflation, a cooling labor market, and high interest rates. This tracks with recent headlines suggesting that consumers were increasingly putting off the purchase of big-ticket items like appliances, furniture, and automobiles but we would have to wait to see a couple more months of data before drawing any real conclusions. With the preliminary Q1 2025 data now in, the strength signaled in last quarter’s read mostly remains though is now concentrated mostly in Nondurables, not Durables, which had been the case last quarter. Durable Goods consumption has faded 50 bps +5.3% Y/Y vs. +5.8% in the prior quarter and +3.5% in Q3 with Nondurable Goods popping 90 bps +3.0% Y/Y vs. +2.1% in the prior quarter and +2.2% in Q3 and Services fading slightly to +2.7% Y/Y vs. +3.0% in the prior quarter and +3.1% in Q3.
Given the relatively higher freight intensity required to satisfy the demand for physical Goods, a sustained recovery in Durable and Nondurable Goods consumption is clearly a bullish signal for future truckload capacity demand. As finished goods inventory is depleted over time, wholesale replenishment orders get triggered more frequently. If sustained, this drives factory orders higher which then requires increased levels of industrial activity to fulfill those orders and replenish wholesale and retail inventories to satisfy future demand. And US truckload capacity is likely going to be needed to move those goods through just about every link in that chain – even more so if more of that production happens in North America as opposed to overseas. But with Goods consumption mostly accelerating higher through Q1 2025, the consumption of Services had remained conspicuously flat from a Y/Y rate of change perspective. So while the argument for consumers reallocating their spending from Goods to Services in a post-COVID economy is logical and often used to help explain the strength or weakness in specific industries like the airlines or global logistics services, there was little evidence in the GDP and Consumption data suggesting that’s what had really been happening – at least not until that Q1 2024 print. But with subsequent prints sharply reversing that relative weakness in Durable Goods consumption, the question remains whether Q1 2024 represented any version of a change in trend or will data points stay on a more constructive trajectory in the months and quarters ahead as the economy seeks to stabilize and Federal Reserve monetary policy likely transitions to expansionary – especially in the face of ongoing tariff volatility. Though now with the total Goods consumption print coming in 40 bps higher vs. last quarter to +5.3% Y/Y, we have to go all the way back to Q4 2021’s +6.6% Y/Y to find a higher number. So far, so good – even if Durables are signaling a little bit of relative softness. But perhaps the real test will be in Q2 as tariff impacts begin to really bite. Tune in next month to find out.
Now with the protagonist of our story, Consumption, continuing to make its case that US Consumers remain mostly resilient and that ongoing relative weakness in Industrial Production is unlikely to last, let’s check in with our villain for the time being – Industrial Production (IP) itself. While our dramatic yet corny ‘Consumption vs. Industrial Production: Which is telling the truth?’ storyline got another jolt this month with final Q4 2024 Consumption hitting the board at +3.1% Y/Y and up 20 bps vs. Q3, it has remained largely unresolved as we had hoped for a little more signal strength in the Q2-Q4 2024 reads on Industrial Production. Coming off a final Q3 2024 read of -0.4% Y/Y, our final Q4 print came in at a slightly stronger but still weak -0.2% Y/Y. So no sign of a meaningful recovery in industrial activity just yet, at least nothing that showed up in the IP data. But we got just that with the January Industrial Production index posting a preliminary Q1 2025 read of +1.2% Y/Y and again this month with the March revision closing Q1 still higher to the same +1.5% Y/Y we got last month. So with Q1 2025 Consumption pointing still higher and Industrial Production finally signaling that it could be ready to close the distance between the two, we score this one again clearly in favor of Consumption in the ‘Which is telling the truth?’ contest. So stay tuned for next month’s issue where we get our first look at Q2 2025 Industrial Production and a revised print on Q1 2025 Consumption to see where they take us as the saga continues.
One of the places we also continue to look for more signals is in relative inventory levels, where an accelerating Inventory-to-Sales Ratio is bearish for Industrial Production and a decelerating ratio tends to be bullish. Recall that, after closing Q1 2023 at 1.38, Q2 took us slightly higher to 1.40 thus signaling that a local peak had yet to be reached and more inventory would have to bleed out of the system before we should expect any meaningful recovery in Industrial Production. When Q3 2023 closed at 1.37 and stayed there through Q4 and then Q1 2024 and still again in Q2, we got a little more signal that Q2 2023 may indeed represent that peak which would be strong confirmation that the fragile stabilization and eventual recovery in Industrial Production is likely to be sustained.
This argument was only strengthened with Q3 2024 once again closing at that same 1.37. Though we noted then that we’d have to see where future prints take us before getting too excited one way or another. But the lack of any real directional action on this indicator did make sense given what we saw from Industrial Production over the same period. Recall that we then got two somewhat constructive signals in the October print. Not only did preliminary Q4 hit the board at a slightly lower 1.37 vs. the prior month’s 1.38, the September revision took Q3 back down to 1.37 as well – making it the 5th consecutive quarter at that level. Geez, talk about stagnation. But with the final Q4 2024 print on the board at a slightly lower 1.36, we finally got some signal that surplus inventory is starting to burn off thus clearing the way for a recovery in industrial activity and ultimately truckload capacity demand. We noted last month that we “only hope that when IP does finally break, it breaks to the upside as opposed to the other direction – and the opposite for inventory-to-sales”. With last month’s update, that’s exactly what looked to be happening. But then the preliminary Q1 2025 print hit the board at a…you guessed it…1.37, putting us right back where we started. And as we noted last month, “with the level of accelerated imports we saw in January and February, it would be reasonable to expect this number to melt up even higher in the months ahead.” While that argument still sounds awfully logical, we didn’t get that with the February revision. Instead, it took Q1 the opposite direction and down two points to 1.35. Though we now have to wait until next issue to find out if it holds up through the final March revision.
As we all know by now, the Inventory-to-Sales ratio historically runs inverse to Industrial Production, which makes sense as bloated inventory levels diminish the need to make more stuff to restock shelves. That means once we finally do observe a local top in the inventory-to-sales ratio, we should expect to see a local bottom in IP – and vice versa. So if a downward trajectory is sustained in the quarters ahead, it would represent an increasingly constructive signal for industrial activity, the demand for TL capacity, and the economy as a whole.
With recent Consumption, Industrial Production, and relative inventory levels all aligned and flashing constructive signals for the first time in two years, let’s turn to our primary TL demand indicators – the Cass Shipments Index, one of the stars of this month’s issue, and the ATA TL Volume Index. Through most of 2023 and into Q1 2024, our chart patterns continued to post mostly Y/Y deflationary and pointing lower. However, from there, we’ve gotten consistent signs of life. After closing Q4 2023 flat to the prior quarter at -8.6% Y/Y, the Cass Shipments Index appeared as though it had finally found a deflationary bottom – which was confirmed with Q1 2024’s -5.2%, Q2’s -5.3% Y/Y and Q3’s -2.8% Y/Y. And while Q4 2024 closed sequentially lower at -3.2% Y/Y, we remained well over Q4 2023’s -8.6% Y/Y inflection point – so the recovery continued. But that all changed with a preliminary January print that took Q1 2025 all of the way down to -12.5% and well beyond the Q4 2023 inflection point. At the time, we stated that “one month hardly makes a quarter. It’s entirely possible that the January read was a weather-dampened anomaly and not representative of the quarter, but we wouldn’t know for sure until March got baked in. Until then, we are to remain cautious not to overreact one way or the other. But if we do somehow trend down at this level going forward, the fundamental shape of this current Y/Y inflationary leg of the new TL spot linehaul rate market cycle will be back in question.” With March now on the board, we finally have our answer with Q1 improving materially to close at a still weak -6.3% Y/Y but decisively above our Q4 2023 inflection point. Now on to Q2.
Our ATA TL Volume Index had followed a similar pattern as it tried to navigate its own cycle inflection. When our final revision for Q2 2024 hit the board at -2.9% Y/Y vs. Q1’s -5.2%, we got strong signal that TL capacity demand may have found a floor and was poised to improve in the months and quarters ahead. But with the final Q3 print on the board at a slightly lower -3.3% Y/Y, that signal got a whole lot weaker. Then our final revision of Q4 hit the board all the way up at -1.4% Y/Y and we were back on track with this TL capacity demand indicator as well. At least we were until this quarter, when last month we got a preliminary Q1 2025 print of -1.6% Y/Y – 20 bps lower than the prior quarter. Though with the March revision taking Q1 all the way back to equilibrium at +0.0% Y/Y, albeit slightly lower than last month’s +1.1% Y/Y, the recovery is back in business. Though if this is driven primarily by supply-side attrition, as suggested earlier, as opposed to an increase in overall capacity demand, the signal is not nearly as constructive. Suffice it to say, we’ll be paying close attention to see where Q2 opens as this particular dynamic takes center stage to potentially help explain what’s really going on in this market and where spot and contract rates are likely to head from here.
Now let’s shift our attention to the supply side and Net Class 8 US Tractor Orders where we had seen more positive developments recently with a final Q4 2024 print of +3.4% Y/Y and a revised Q1 2025 mark of +4.9% Y/Y, taking us north of the x-axis and arguably back on track pattern-wise. But with the March revision taking the final close back to -18.2% Y/Y and decisively deflationary, so much for that. And with tariff uncertainty now tilting consensus outlook for the economy ahead decidedly negative while the publicly traded motor carriers continue to underperform financially, it’s hard to imagine too many fleets making big swings at new tractor orders. And with April’s preliminary Q2 number now on the board at an off-the-cliff -55.5% Y/Y, that’s exactly what we got. In fact, you’d have to go all the way back to May 2020 to find a lower print on net tractor orders. We’ll have to wait to see how Q2 develops from here before getting too excited one way or another, but the market reaction so far from this first leg of the Trump economic Triple Lindy certainly doesn’t inspire confidence.
While Net Class 8 Tractor Orders have bounced around over the last two years, the roller coaster in US retail diesel prices over the same period has been arguably even more impactful to US TL market dynamics. After running -19.3% lower over the first half of 2023 ($4.714 to $3.802), we marched +20.0% higher in Q3 ($3.802 to $4.563), then reversed course yet again to fade -13.0% lower in Q4 ($4.563 to $3.972). From there, we faded another -6.3% lower to close June and Q2 at $3.722/gal before once again reversing the trend to move +2.4% higher in July to $3.810/gal. But with Q1 and early Q2 2025 now behind us, the market has faded another 24 cents lower and now sits at $3.567/gal. While certainly not the whole story, this long-term slide in diesel prices over most of the past year has no doubt been one of the factors allowing otherwise unprofitable surplus suppliers to remain active in the spot market – that and some combination of surplus profits generated in 2020-22 and possibly a surge in SBA loans granted under COVID stimulus programs with wildly favorable terms.
To zoom out a bit and further recap diesel’s wild ride for anyone who hasn’t been paying attention, the price of diesel had finally started to correct lower in mid-2022 after exploding steadily higher for much of the year up to that point – from $3.727/gal in January 2022 to $5.754/gal in June before retreating slightly to close September just barely under $5/gal at $4.993. This took the final read on Q3 2022 to +53.8% Y/Y after peaking at +70.7% in Q2. Unfortunately, however, diesel reversed once again to jump +5.0% (+$0.26/gal) higher through November to close at $5.255 on fears of a US diesel shortage driven by diminished refinery capacity in the northeast. Ultimately, those fears proved to be unfounded as diesel instead reversed course once again and ran -27.7% lower to June 2023 at $3.802/gal and a Q2 average of -28.1% Y/Y. But just when we were starting to lose interest, July came along and initiated the reversal in trend that took prices steadily higher through September and $4.563/gal. It proved to be short-lived however, with yet another reversal that looked temporary at the outset but has only picked up steam – with April 2025 coming in at -21.8% from the September 2023 high mark despite brief turns higher in July, October, January, and February. So with momentum swinging from month to month while 2025 global energy forecasts continue to diverge, it is hard to say where diesel goes from here in the short term especially given the conflicts still raging in the Middle East and Ukraine, disruptions in the Red Sea, and the shifting demand outlooks for both the US and China given new concerns around tariffs, trade policy, and government spending.
As noted in past issues and repeated here for any new readers, the last time we saw anything like 2022’s spike in fuel prices was in 2008 when diesel climbed to +66.6% Y/Y that June – in the throes of The Great Recession. During that particular US TL Spot Linehaul Rate Cycle, unlike this one, diesel spiked higher several quarters ahead of spot and contract rates. As a result, we saw an unprecedented wave of motor carrier bankruptcies and exits as profitability was violently wiped out – especially for those most exposed to the spot market. The key difference this time around is that spot and contract rates led diesel by several quarters, which allowed the market to absorb the diesel shock without forcing carriers out of the market in material numbers at the same rate. And so far at least, it has been a much more gradual exit. As the battle between spot market rates and carrier operating costs rages on, the role that diesel prices have played has been in helping to set the ultimate market bottom where our Y/Y US TL Linehaul Spot Index line finally inflected higher as sufficient surplus capacity has been forced to exit as their operating margins evaporate. And as noted here, we believe we found that bottom with the confirmation of Q1 2023 as our deflationary inflection point. Going forward, diesel’s role remains that of a pacesetter. If prices change course to move higher, then the pace of exits likely accelerates a little. Should they continue to fade lower, all else equal, then the pace of exits likely slows which would be a headwind for TL spot rates and would slow the overall market recovery towards its next Y/Y inflationary peak.
So here we sit with a final Q1 2025 print at +2.4% Y/Y, the third consecutive inflationary mark in a row (but trending materially lower since the third week of January) – and a preliminary Q2 2025 mark back on the deflationary side of the axis at -1.2% Y/Y. Consumption is still flashing positive signals while Industrial Production and Relative Inventory levels also show promising signs of finally breaking out of prior patterns to their more constructive upside trajectories. So what’s going to move the needle on Spot TL rates one way or the other in the month ahead? As we noted last month, “with the haymaker of an announcement on Liberation Day April 2nd of incremental tariffs on every country that imports into the US, trade policy now takes center stage as the leading catalyst for where both the trucking market and the broader US economy go from here.” And that remains the case this month.
While we continue to expect that the US TL Spot Linehaul Rate Cycle indeed stays undefeated over the long term, we can’t ignore the recent relative weakness and the “off-pattern” kink we now have confirmed on the board for Q1 and now Q2. If Q2 ultimately closes higher than +2.4% Y/Y as projected, then a “kink” will likely be all that this irregularity is viewed as. If not, then the fundamental shape of the cycle going forward is going to be in serious question. So with all of that said, let’s break down our slightly longer list of freight market wild cards for the month ahead, with tariff-driven consumption and industrial activity distortions now taking the top spot:
1. Global Trade War/Tariffs Impacts: As noted at the top, given recent escalations in what had been a simmering trade war between the US and the rest of the world, the longer that tariff-based trade barriers remain raised, the more destructive the short-term impact is likely to be. While we expect rapid resolution across a wide swath of the newly burdened trading partners (Vietnam, Cambodia, Israel, etc.) it will likely be the path forward with Mexico, Canada, China, and the EU that move the needle the most on this front. If there is sufficient relief by the end of Q2 that Consumption levels hold onto the strength they had shown through last quarter, then spot rates likely rip higher on the back of an increasingly depleted supply base throughout the same period. If not, then we likely see the spot market bounce along equilibrium at a range-bound at 0.0% + 5.0% Y/Y through the end of the year.
2. TL-Intensive US Consumer Spending: Consumer spending (as a proxy for future TL capacity demand), also somewhat of a derivative of the tariff wild card but we’ll keep separate for now, bumps back down a notch. Conditions remain tough to say the least for the average US Consumer, despite ample signal that peak Consumer Price Inflation (CPI) is well behind us after many months of slow yet uneven sequential decline. After correcting all the way from June 2022’s +9.1% Y/Y to June 2024’s +3.0% Y/Y, we have continued to fade mostly lower at prices further stabilize – with March 2025 on the board +2.4% Y/Y. And with the Price Index for Personal Consumption Expenditures, the Fed’s preferred inflation metric, also fading steadily lower in recent months (+2.3% in March 2025), we are seeing mounting evidence that perhaps this time a < 3.0% CPI environment could potentially stick around – at least that was the case prior to the aforementioned trade war. Now all bets are off, and it will be the Consumer’s ability (or not) to endure potentially even stiffer headwinds that determines where the economy and the freight market go from here.
3. Diesel Prices: As noted, now that we’re well beyond our Y/Y US TL market cycle bottom, we believe that diesel prices in the months ahead will help set the pace at which spot market rates continue to recover from here. While prices have been on a bit of a roller coaster ride over the last two years, we suspect that the downtrend we got through the first half of 2023 and again over the last nine months, January and February 2025 notwithstanding, only prolonged our time down here at the bottom of the cycle. The lower that diesel went, the lower the market allowed Spot linehaul rates to go. After declining steadily by an aggregate -27.7% from November 2022 through June 2023, diesel reversed and marched +20.0% higher from there to September 2023 before reversing again to fade -21.8% lower to April 2025’s $3.567/gal. If this mostly downward trend is sustained and we continue to head materially lower, we should expect the pace of carrier exits to stall even further (all else equal), which would continue to throttle the ultimate recovery in spot rates – notwithstanding the impact of tariff-driven market distortions.
With the prior cycle still firmly in the rearview mirror, we can look back and reflect a bit despite the increasingly uncertain path in front of us. While the deflationary leg indeed took us far lower than those that came before (-31.8% Y/Y vs. last cycle’s -19.0%), it also took us two quarters longer than the seven-quarter deflationary leg of the last cycle (Q4 2018-Q2 2020) and the seven-quarter deflationary leg of the cycle before that (Q3 2015-Q1 2017). So, incredibly challenging market conditions for sure for most of those on the supply side, but hardly ‘unprecedented’ or ‘generational’ in nature – even considering the lower low and the longer duration. And if this cycle was more like past cycles than it was different, we should be able to anticipate typical market behavior as this Y/Y deflationary leg slowly but surely came to a close and the Y/Y inflationary leg of the new cycle began – and then recommend how best to position. So as outlined in recent issues and revised here for all of you first-time readers, we recommend some version of the following for both supply-siders and demand-siders as we continue to limp out of the gates of this new cycle.
For motor carriers and brokers operating on the supply side of the market, this likely means keep doing what you’ve been doing over the last year and a half – at least if that means cutting costs, getting leaner, and conditioning your teams to be able to do more with less. While we absolutely see the light at the end of the tunnel with some version of the beginning of a recovery in spot TL linehaul rates already in motion, the market correction is virtually guaranteed to be uneven – with different industries, geographies, and equipment types all evolving at their own pace. Also, as noted last month, while the rate of recovery can look pretty dramatic on our Y/Y cycle charts, the sequential development of the market rates each of us experiences will feel altogether different. For example, even if spot rates found a way to go on to close Y/Y inflationary in Q2 2025 at +5.0% Y/Y as revised down last month, that only represents a +5.9% increase from current levels.
And with the Q1 TL Contract Linehaul (Cass) Index breaking Y/Y inflationary at a revised +1.4% Y/Y for the first time since Q4 2022, its trajectory from here was recently revised lower as well. But regardless of the ultimate pace at which the market breaks Y/Y inflationary over the quarters ahead, there is little downside in remaining disciplined and pursuing operational excellence in whatever it is you do – especially now that conditions just got a lot more challenging with the great economic reset. As you prepare for the balance of 2025, the months ahead represent a welcome opportunity to refine your commercial strategy and carefully consider the shippers that you want to partner with going forward into the next cycle. So hopefully you are choosing wisely, as those who navigate the cycle most successfully over the long run tend to be the ones with the most durable long-term commercial relationships with partners that have earned their trust through both the ups and the downs.
And for shippers on the demand side of the marketplace (and brokers that operate on both sides), our guidance is similar. While the most recent Y/Y deflationary leg of the cycle has technically ended, the months ahead represent a tremendous opportunity to recalibrate your transportation strategy for the Y/Y inflationary leg that had just begun pre-trade war. The race to the bottom of the TL market that you have enjoyed up to this point is mostly over, but its lingering impact is almost certainly masking weaknesses and deficiencies that will take a toll later this year if left unaddressed. So now is the time to examine your current and projected freight flows to understand where alternative modes, operating models, and capacity partners could create a comparative advantage – whether it be from cost, speed, utilization, or flexibility – in an inflationary TL market or one made all the more volatile with evolving trade conditions. With the cost of capacity increasingly on the rise, the penalty for waste only increases from here. So, focus on filling your trailers and intermodal boxes, or find a way to only pay for the space you need (the cost for shipping air is likely going up, not down!). And work to eradicate empty miles and excessive dwell times from your networks. Remember that 2025’s winners will be determined by the actions taken now. Aspire to be considered a ‘Shipper of Choice’ throughout the cycle, not just when the financial pressures of an inflationary rate environment force your hand.
From here, we now expect to close Q2 2025 up to +5.9% higher to reach +5.0% Y/Y and to run increasingly inflationary, albeit at a more tepid pace as expected prior to the trade war, as we kick off the next three-to-four-year US trucking market cycle. We continue to project contract linehaul rates, after breaking Y/Y inflationary this quarter, to run higher through 2025 and into 2026 as primary tender acceptance rates deteriorate, routing guides spring leaks, and freight contracts are reset through a flurry of mini-bids – just like in 2017 and 2020-21. Though now expect this to get accelerated even further as transportation networks are thrown into tariff-driven disarray. Regardless, we hope that this time around, the industry and its trading partners will have more effective tools at their disposal to make better use of the capacity that already exists in the market (across all modes) such that the supply side won’t be baited into overshooting to the same degree as in cycles past. And that the dramatic volatility of this market can begin to be tamed such that we’re not all doomed to a future defined by higher peaks and lower troughs. But until then, the roller coaster must unfortunately continue.
So just as all looked to be tracking a year ago for a Q1 2024 that marked the end of a long and painful (if you’re on the supply side) deflationary freight recession coming out of January, the supply side somehow found a lower gear and took US Spot TL Linehaul rates all of the way back to their 2023 lows and well below estimated operating costs per mile. In fact, our models estimate that all-in spot TL rates have been unprofitable for the average US motor carrier since Q2 2023 with recent levels at the lowest we’ve seen since the great recession and financial crisis of 2007-09 – with only moderate improvement in 2025 so far. But whether this unexpected supply-side resilience can be attributed to the disciplined use of windfall profits earned in 2020-2021 or under-market leases secured over that same period or sweetheart SBA loans granted under COVID stimulus programs, these are not permanent advantages. Eventually, surplus savings are depleted, credit lines are tapped out, lease terms expire and mark to market, and loans must be paid back. And that is what we believe is playing out in the market right now. So while we continue to believe that, at this point in the cycle, the attrition of unprofitable capacity will be enough to tip the market to a state of relative supply scarcity and therefore an increasingly Y/Y inflationary spot linehaul rate environment in the quarters ahead, even in the face of a self-induced US recession, that alone won’t likely surge rates to the levels seen in last cycle’s Q2 2021 +56% Y/Y peak. Instead, we’d probably be looking at something closer to the +20.0% Y/Y peak we saw during the 2007-2009 financial crisis.
To correct any higher than that, we would need a material recovery in TL capacity demand and therefore US industrial activity – as noted a couple of issues ago before the most recent tariff shots were fired. That was what the January issue’s “little ditty ‘bout truck-ing de-mand” was all about. Sure, Imports are meaningful, but are only a secondary catalyst at best. It’s Industrial Production that sets the pace. Can the recent strength in consumption, industrial production, and relative inventory levels be trusted as constructive signals for what might lie ahead? Or was the January Y/Y collapse in the Cass Shipments Index the more reliable indicator? And has the first phase of the Triple Lindy changed everything? At this point in time and with the data we have in front of us, the path forward certainly looks to be a lot more benign than past cycles, but we probably could have said the same at the same point of each of those past cycles. And while the next roller coaster ride may not be as stomach-churning as the last one, there is plenty that could happen along the way to change that – from tariffs and trade wars to geopolitics and US government reform. Though whatever may come to pass, we still don’t expect the fundamental shape of the cycle to change a whole lot given how little has changed in the fundamental structure of the trucking market. It’s still really big, still really fragmented (if not more so), and still forced to make long-term supply decisions in silos based on near-term information. And now that the inevitable buy-side freight market winter is upon us, even if conditions have eased in recent weeks, market conditions should finally support at least some version of a sustained supply-side rate recovery in the quarters ahead. We just might not like how we get there if it’s primarily on the back of supply-side attrition as opposed to rising demand for spot and contract truckload capacity.
But as the market and the world continue to get really weird again, it’s important that everyone maintains perspective and focuses on the things they can control. Though we know that’s often much easier said than done. All of the operating improvements and efficiencies gained over the recent Freight Recession will pay off regardless of market conditions – whether they be driven by technology, talent development or strategic core carrier or shipper programs. Building velocity, flexibility and nimbleness is about as much of an all-weather strategy as you can get. So for those that came into 2025 prepared to be agile, you should feel confident in your ability to navigate whatever comes next and outperform your competition. For those that didn’t, it’s never too late as “wait and see” will eventually cease to be a viable strategy as this trade war rages on. Remember, with chaos comes opportunity. Onward we go.