
[Excerpt from The Pickett Line October 2025 Issue]
Well, we made it to another December Ladies and Gentlemen. And in looking back over the 2025 we’ve just about grinded our way through, we can’t help but marvel at how much in the world has changed…yet we find ourselves in virtually the exact same position in the US Spot Truckload Linehaul Rate Cycle as we were last year at this time. Back in the October 2024 issue, we’d just broken Y/Y inflationary the quarter before and were on track to close Q4 at +4.8% Y/Y – which could only mean, if history was to repeat itself, that 2025 was on track for a long-awaited cyclical correction and for spot linehaul rates to run +30-40% higher by the end of the year. But alas, it was not to be – as we are all now painfully aware. Along came Liberation Day and the wildly volatile and unpredictable tariff-driven trade war initiated by the Trump white house with the stated objective to reset global commerce after decades of unfair anti-US trading practices. Whether any version of that actually happens over the long-term, the short-term impact was a dramatic pullback in industrial activity and US truckload capacity demand. And the impact on the rate cycle was nothing short of an abrupt market pause that lasted every bit of three whole quarters.
In the meantime, the exit rate of surplus capacity has only just accelerated enough to overcome the downdraft in freight volumes to return the rate cycle to its normally scheduled program where history once again continues to rhyme. So here we sit at +2.9% Y/Y for Q4 with most of December still left to go, and once again projecting US spot truckload linehaul rates to surge higher over the year ahead. And now with the stage set for this this special October 2025 holiday issue of The Pickett Line, it’s time for perhaps the most beloved tradition we have here at Pickett Research – then annual holiday poem, inspired by Clement-Clarke Moore’s ‘A Visit from St. Nicholas’:
Happy Holidays 2025 everyone! Now, let’s get on with it. So about those drivers that “were willing to run cheaper, some way and some how” through this artificially elongated freight recession? Recall that we focused much of last month’s issue on the perhaps long overdue flash of insight we finally got to potentially explain what had allowed enough of the supply side to operate in the red for so long, as shown below in that issue’s ‘Chart of the Month’ – included here again on the following page. Perhaps the greatest unsolved mystery of this freight recession had been in understanding exactly how many carriers have been able to survive for so long with all-in spot market rates running below estimated per-mile operating costs for the longest period since the Great Recession back in 2007-09 – and thus delaying what had up to this point been a relatively predictable spot market rate cycle.
In the chart below, we show the estimated motor carrier operating profit per mile through the US TL Linehaul Spot Rate Cycle going back to 2007. When the bars are in the black, that means that all-in TL spot linehaul rates (including fuel) exceed the average estimated operating cost per mile as reported in ATRI’s annual ‘An Analysis of the Operational Costs of Trucking’ report. And when the bars are in the red, where the market has been going on 11 quarters, those operating costs (which include fuel, driver wages and benefits, lease costs, insurance, tires, tolls, etc.) exceed the national average all-in rate per mile that the spot market is paying.
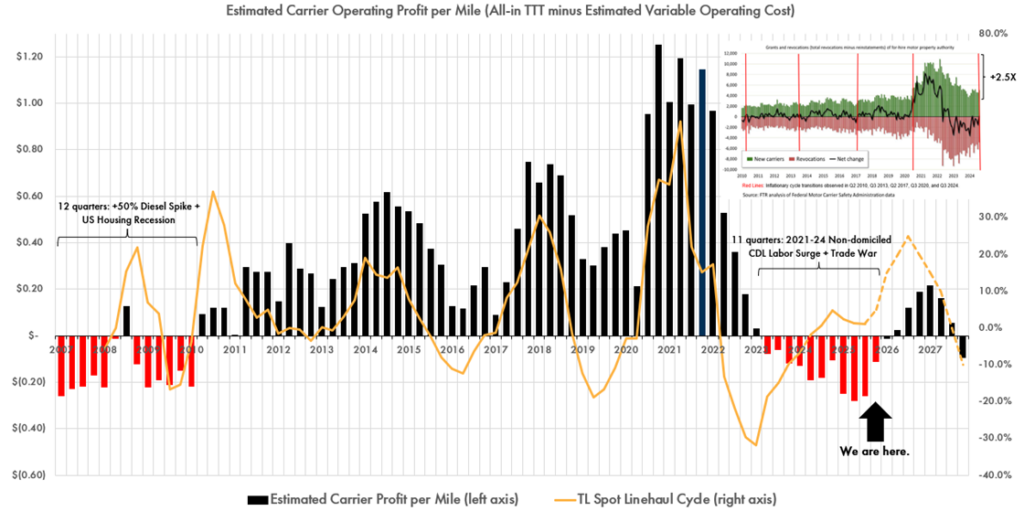
In the chart above, we show the estimated motor carrier operating profit per mile through the US TL Linehaul Spot Rate Cycle going back to 2007. When the bars are in the black, that means that all-in TL spot linehaul rates (including fuel) exceed the average estimated operating cost per mile as reported in ATRI’s annual ‘An Analysis of the Operational Costs of Trucking’ report. And when the bars are in the red, where the market has been going on 11 quarters, those operating costs (which include fuel, driver wages and benefits, lease costs, insurance, tires, tolls, etc.) exceed the national average all-in rate per mile that the spot market is paying.
So for enough of the supply side to sustain operations while the broader market is in the red, something we again haven’t seen in 15 years, that can only mean that there are a bunch of carriers out there with the financial resources to continue operations where every incremental mile is unprofitable – no doubt in an attempt to weather the storm and recover when the market inevitably corrects higher. And there have been a number of theories floated along the way, by Pickett Research and others, to explain how they may have been able to do so – from 3-year truck leases secured prior to lease costs surging higher with interest rates starting in early 2022 to COVID-era Small Business Association (SBA) loan proceeds splashed around with sweetheart terms to disciplined operators banking windfall profits during the 2020-2021 COVID-era cycle boom that they are now able to draw on to subsidize an underwater spot market.
And while some or all of those catalysts may have been a factor for many carriers along the way, it seems really hard to believe that they could have impacted the market enough to explain both the conspicuously long duration of the Y/Y deflationary leg of the last rate cycle from 2022-24 and the last four to five quarters of an equally conspicuous flattening of the rate curve at < +5.0% Y/Y. But what if there was a more systemic dynamic in play that evolved right under our noses to explain this? That is exactly what we now propose as we connect the dots between the rise in non-domiciled CDL drivers and the relative market cost of that labor through the cycle.
First, consider that fuel and labor historically account for 60-80% of operating costs for the average US motor carrier – as reported by ATRI based on the carriers that respond to their survey every year. So over two thirds of the operating expenses that compare with all-in spot market rates to form the black or red bars in the featured chart are from these two costs alone. Historically, it has been our hypothesis that the cost of labor doesn’t change all that much on a year-to-year basis – at least as compared to diesel prices which showed greater levels of volatility over the years and which often had a direct impact on spot market freight rates. So we tended not to focus much on labor costs and assumed that, while there were no doubt differences in those costs based on region or equipment/fleet type, the market as a whole tended to have mostly comparable labor costs on a year-to-year basis. That said, it is widely understood that owner-operators or small fleets where the owners are the ones behind the wheel, tend to have a lot more wage flexibility than larger carriers or private fleets with hired drivers. And that cost structure would allow them to operate at moderately lower freight rates than their larger competitors without going bust – for at least some period of time. And partially as a result of that, the observation has been made that a cohort of carriers clearly still exists that has found a way to operate at $1.50/mile – whether profitably or not.
So how are they doing it? As outlined last month, we now believe the answer is two-fold. One, just the sheer magnitude of the surge in operating authorities granted and therefore new MCs entering the market during the COVID and post-COVID boom years of 2021-24, while a number of larger fleets like David Express and now 10 Roads have been forced to exit, suggests that the market has trended towards more fragmentation not less – so relatively more owner-ops and small fleets with more flexible cost structures than in past cycles. But we think the real story stems from the relative rise in non-domiciled Class A CDL drivers through the COVID cycle – accelerated by loose immigration policy and material weaknesses in the application process itself in states like CA, TX, PA and IL.
And this dynamic is what we now believe is likely the smoking gun that explains both the depth and the duration of the current freight recession. Left to its own devices, we believe the market would still grind through its normal Darwinian process of weeding out unprofitable surplus supply over time – albeit at a much slower pace than in the past, something we have all experienced directly over the last two years. Consider that prior to 2015 when many state non-domicile CDL programs were expanded, deflationary market corrections took on average three quarters to move from their deflationary inflection point back to equilibrium. The 2016 recovery took four quarters, which was followed by a 2019 recovery that took five quarters. The 2022-24 recovery took six, before going on to stall out and hover at < +5% Y/Y for another five quarters. So while the foundational battle between supply and demand that governs overall cycle dynamics remains intact, something clearly appears to have evolved that has stretched the duration of our corrections. And we believe that “something” is materially increasing relative labor wage flexibility driven by the increasing level of fragmentation overall, but more so by the increasing proportion of non-domiciled CDL drivers out in the long-tail of owner-op and small fleet capacity.
We make no claims here around the skill, ability, or safety record of the non-domiciled and/or non-EPL compliant CDL population relative to their US-domiciled counterparts. And while it’s hard to argue that non-English speaking or reading drivers don’t pose a potential safety risk to US highways, whether that has proven to be the case over the years is probably unknowable. That said, none of that really matters with regard to this particular argument. The fact that EPL regulations are now being enforced during DOT inspections, the immigration status of Class 8 truck drivers is being screened at highway and facility checkpoints across the country, and non-domiciled CDL programs are being scrutinized, if not shut down altogether, will immediately begin to reverse these driver cohort trends – both by putting more drivers out of service and by making it more difficult if not impossible for new non-domiciled labor to enter the market in the first place going forward. Or in other words, the market will not be left to its own devices in the quarters ahead as spot linehaul rates seek to correct higher. An evolving regulatory landscape is going to pressure the supply-side recalibration by accelerating the exit of what we propose is a cohort of drivers and carriers that, up to this point, have been willing and able to run at materially lower labor rates than the broader market.
And that is the insight that had eluded us over the last year as we’ve struggled to understand and explain why it has taken so long for the market to break Y/Y inflationary (and stay there) from its last deflationary inflection point all the way back in Q1 2023. But with market forces, in the form of federal regulations, now in place to accelerate the reversal of this trend, we expect future cycles to look a lot more like those that we observed prior to the most recent COVID and Russia-Ukraine distorted one that we are still trying to break free from. In the meantime, we now understand the extent to which the supply side has evolved over the last twenty years as a result of immigration policy and the ill-advised and ultimately untrue driver shortage narrative. So getting to more accurate and complete data on the segmentation of the estimated four million Class A CDL truck drivers that comprise the supply side of the market is going to be increasingly important when it comes to forecasting the shape of the rate cycle going forward. We finally understand it now. And we’ll unpack it all in this month’s October 2025 issue of The Pickett Line.
As we look back at all that has led us to this point, we see an unusually inflationary January where spot market rates shrugged off typical seasonality and ran materially hotter than December, before turning over and tumbling lower through the end of April – the net impact of which was a final Q1 print on the US TL Linehaul Spot Index all the way down at +2.4% Y/Y, followed by a Q2 and Q3 mark of +1.2% Y/Y. Compared to a mid-January mark of +12.5% Y/Y, this continues to represent a monster of a retreat.
Recall that after breaking on through (-‘to the other side’ – hat tip to Jim Morrison and The Doors) in the June 2024 issue with a very preliminary Q3 read of +3.0% Y/Y, we went on to close the quarter at a weaker but still inflationary +0.6% Y/Y, thus finally getting the closure we had been waiting for and completing Cycle Five on the Pickett Research freight cycle timeline and setting up our now current Cycle Six. That meant we finally exited the longest observed market cycle on record (albeit a relatively short record at 18 years) at 16 quarters (Q3 2020 – Q2 2024) vs. the typical 13-14 quarter cycles that came before. From there, our final Q4 2024 print on the US TL Linehaul Spot Index showed us indeed holding trend at +4.8% vs. a forecast of +7.5% + 5%. But instead of marching higher into 2025 as projected, the freight market ran headlong into the immovable object of the Trump Trade War and the deterioration of US truckload capacity demand that came in it triggered. Q1 faded to +2.4% Y/Y before flattening at +1.2% Y/Y over the subsequent two quarters. And while preliminary Q4 marks have lifted the index to +2.9% Y/Y with just under a month to go, we remain conspicuously off-pattern. This makes the months ahead all the more interesting, starting with where we go on to close Q4 and open Q1 of the new year.
So what does the current market trajectory mean with regard to expected market behavior? How are buyers and sellers likely to act? Who is preparing for winter and what does that even mean? As noted in recent issues and summarized again here for any new subscribers, with the projected spot market cycle bottom now in (and recently re-tested), many enterprise procurement teams have logically looked to extend the duration of their contracts to try and ‘lock rates in at the bottom’ – which never really works over the long term yet represents a short-term temptation that is often difficult to resist. We estimate that through the duration of the most recent inflationary leg of the rate cycle from Q3 2020 to Q1 2022, TL spot linehaul rates ran at an +18.1% premium (or penalty if you’re on the buy-side) to contract rates – with the first two quarters representing the worst of it at +20-23%. This compares to an average premium/penalty of +10.4% during the last inflationary leg before that (Q2 2017 to Q4 2018), so cycle amplitudes have clearly increased.
We also can’t ignore the COVID-driven boom in the demand for goods that helped rally the 2020-22 leg, but to what extent we’ll never really know for sure. In other words, it appears that the US TL spot market is getting more volatile, not less. Therefore, spot vs. contract linehaul premiums could easily exceed +15-20% by 2026. And when we put it this way, who could blame procurement teams for seeking to extend contract terms? It’s just a matter of whether the suppliers on the other side of those agreements will ultimately honor them over the entire term, which will be at least somewhat driven by the shippers’ own behavior over this recent record cycle trough. More specifically, if they went out and re-bid what had previously been characterized as contract awards prior to the end of the contract term, they effectively signaled to their supply base that it is entirely acceptable to give back contract freight prior to the end of the contract term if it suits them. So, as is often the case in reciprocal trading agreements, it goes both ways.
That means many may have seen what used to be shorter-term quarterly or six-month bids increasingly transform into one- or even two-year commitments when the time came to renew. But by early next year, we should also look for many of them to unravel as primary tender acceptance rates start to fall back towards 2020-21 levels. That said, all is not lost if you are one of those procurement teams that run this playbook, usually under duress from a finance organization or executive leadership team looking to drive operating costs lower by any means necessary – especially as tariffs begin to bite. You’ll just need to be especially agile as the freight market landscape shifts in the quarters ahead. To that end, if you haven’t done so already, we recommend that you invest in the technology and tools required to give your team the visibility and control they need to track the performance of your contract lanes and carrier partners on at least a weekly basis, and then be in a position to take decisive action if necessary – from rebidding lanes away from underperforming vendors to procuring surplus backup capacity at rates likely to be more attractive than what you’ll find in the spot market when you need them, to leveraging more dynamic contracts that adjust more frequently based on market indices or benchmarks.
If you’re unable to position for long-term performance to begin with because global procurement best practices dictate otherwise, the next best thing is to build the operational flexibility to course correct and adapt before your competitors do as the economy and market evolve and the freight cycle marches on. In this regard, if speed is king, pre-planning is queen. The faster that Shippers and Carriers alike can identify meaningful market or network signals, understand their potential implications, and take action, the better they are likely to perform as we navigate these unprecedented times ahead of us.
Now on to the October macro update, where most of our primary indicators were finally updated from the prior month after delays from the government shutdown – with the exception of the preliminary print for Q3 Consumption and GDP. After continuing to question in recent issues whether the relative strength signaled in recent prints would continue to hold up or if this was yet another macroeconomic head fake as tariff impacts begin to show up in the numbers, we held our ground last month, and then some, with constructive prints across the board – most notably in the September update to Industrial Production.
Recall that the big news way back in October 2023 was a preliminary Q3 2023 Consumption read of +2.2% Y/Y, which was decisively higher than Q2’s +1.8%. Our guidance at the time was that if this trajectory holds over the next quarter or two, it would signal that a recession in 2024 was unlikely – at least according to patterns observed over the last fifty years. That didn’t mean it couldn’t happen, just that historical precedence suggests otherwise. Then with the final revision closing the quarter at +2.4% Y/Y, it became official and was only reinforced by Q4 2023’s +3.0%. But would the uptrend stand, we wondered? Or would Q1 2024 tip us in the other direction? With Q1 closing at +2.2% Y/Y, while slightly lower than Q4 2023, we remained mostly pointed up and to the right. Though given the recent relative weakness in labor markets and retail sales at the time, the US economy was hardly out of the woods. And much still had to go right to stick that soft landing that Jay Powell and the Fed had been doggedly pursuing. But with Q2 2024 hitting the board at a materially higher +2.7% Y/Y, Q3 at +3.0% Y/Y, and Q4 coming in at a still higher +3.1% Y/Y we saw the case for that soft landing looking pretty good.
At least, that was before April 2nd Liberation Day. From there, consensus forecasts pointed to a much lower Q1 2025 print on GDP and Consumption. We noted a couple of issues ago that “if we do get a sharp move lower, then of course the risk for recession as early as Q3 would increase. But we’ll be heading into that weakness with what had been a relatively strong economy and the momentum in place to hopefully shrug off at least some of the negative market forces we’ve outlined as part of Trump’s Triple Lindy in progress.” But as we saw in our March Chart of the Month, while we did technically get a negative Q/Q print on GDP at -0.07%, that was only because of the massive pull forward on Imports and a reduction in government spending. With preliminary Q1 2025 Consumption hitting the board at an unexpectedly solid +3.1% Y/Y and closing there, we got no signal yet that points to imminent recession. But with our final glimpse at Q2 2025 showing only 40 bps of degradation to +2.7% Y/Y after revising higher from last month’s +2.4%, we have little choice but to remain just a little cautious in the outlook from here. Still no imminent recession this year, but the odds have notched slightly higher for 2026. But as it stands, US Consumers have continued to mostly shrug off what has become yet another market headwind – despite all of the doomsday headlines that have increasingly dominated the media over the last couple of months. But whether the “tariffs = crippling consumer inflation” narrative is simply proven wrong this time around or whether it’s just too early to see it show up on the macro data yet remains to be seen.
But how constructive are these recent Consumption prints, really? Was all of the strength in the Services segment at the expense of Goods consumption driven by a material reallocation of post-COVID spending, as many of those same economists and market pundits have suggested? Just as we did last with last quarter’s mark, let’s take a look under the hood to find out. Recall that in Q4 2023 we found that both Durable and Nondurable Goods consumption surged materially higher while Services remained flat, contradicting the prevailing narrative around the reallocation of consumer spending from Goods to Services. In Q1 2024 however, we finally saw signs of a potential reversal in trend with Goods turning over sharply while Services started to show more life. Durables slowed all the way down to +1.2% Y/Y and Nondurables to +1.6% Y/Y. Services, on the other hand, moved slightly higher to +2.5% Y/Y where it had remained mostly range-bound between +2-3% over the prior seven quarters.
Up to that point, it had appeared that the demise of Goods consumption (relative to Services) had been greatly exaggerated. But if these more recent trends held through upcoming revisions, it would make for a pretty strong signal that consumer appetite for durable goods was finally waning in the face of a raft of macroeconomic headwinds including compounding inflation, a cooling labor market, and high interest rates. This tracks with recent headlines suggesting that consumers were increasingly putting off the purchase of big-ticket items like appliances, furniture, and automobiles but we would have to wait to see a couple more months of data before drawing any real conclusions. With the final revision for Q2 2025 now in, the cracks seen forming last quarter are starting to widen, albeit not by much – with weakness concentrated mostly in Durables and Services. Durable Goods consumption has faded 140 bps to +4.9% Y/Y vs. +6.3% in the prior quarter and +7.0% in Q4 2024 with Nondurable Goods sliding 50 bps +3.2% Y/Y vs. +3.7% in the prior quarter and +2.8% in Q4 and Services fading 20 bps to +2.2% Y/Y vs. +2.4% in the prior quarter and +3.0% in Q4 2024.
Given the relatively higher freight intensity required to satisfy the demand for physical Goods, a sustained recovery in Durable and Nondurable Goods consumption is clearly a bullish signal for future truckload capacity demand. As finished goods inventory is depleted over time, wholesale replenishment orders get triggered more frequently. If sustained, this drives factory orders higher which then requires increased levels of industrial activity to fulfill those orders and replenish wholesale and retail inventories to satisfy future demand. And US truckload capacity is likely going to be needed to move those goods through just about every link in that chain – even more so if more of that production happens in North America as opposed to overseas. But with Goods consumption mostly accelerating higher through Q2 2025, the consumption of Services had remained conspicuously flat up to now down from a Y/Y rate of change perspective.
So while the argument for consumers reallocating their spending from Goods to Services in a post-COVID economy is logical and often used to help explain the strength or weakness in specific industries like the airlines or global logistics services, there was little evidence in the GDP and Consumption data suggesting that’s what had really been happening – at least not until that Q1 2024 print. But with subsequent prints sharply reversing that relative weakness in Durable Goods consumption, the question remains whether Q1 2024 represented any version of a change in trend or will data points stay on a more constructive trajectory in the months and quarters ahead as the economy seeks to stabilize and Federal Reserve monetary policy likely transitions to expansionary – especially in the face of ongoing tariff volatility. Though now with the total Goods consumption print coming in 80 bps lower vs. last quarter to +3.8% Y/Y, not counting the last two quarters, we have to go all the way back to Q4 2021’s +6.6% Y/Y to find a higher number. So far, so good – even if Durables are now signaling a little bit of relative softness. But perhaps the real test will be in Q3 as tariff impacts begin to really bite, or so we’re told. Only time will tell, so we all better tune in next month to find out either way – assuming the government is back open by then.
Now with the protagonist of our story, Consumption, continuing to make its case that US Consumers remain mostly resilient and that ongoing relative weakness in Industrial Production is unlikely to last, let’s check in with our villain for the time being – Industrial Production (IP) itself. While our dramatic yet corny ‘Consumption vs. Industrial Production: Which is telling the truth?’ storyline got another jolt a couple of months ago with preliminary Q1 2025 Consumption hitting the board at +3.1% Y/Y, and sticking to close there, it has remained largely unresolved as we had hoped for a little more signal strength in the Q2-Q4 2024 reads on Industrial Production. But it unfortunately was not to be, with IP running mostly range-bound at -0.5-1.0% Y/Y through the end of the year. But we finally got some life in 2025 with Q1 IP opening the year at +0.7% Y/Y. We then took a slight step backwards in Q2 at +0.5% Y/Y, but have since turned higher with the final Q3 mark now on the board at +1.4% Y/Y and the strongest print since Q3 2022. So with Q2 2025 Consumption mostly holding up and Industrial Production finally signaling that it could be ready to close the distance between the two, we score this one again in favor of Consumption in the ‘Which is telling the truth?’ contest – though with a little more conviction than we’ve had in recent months. Again, better stay tuned for the next issue where we get our first look at Q4 2025 Industrial Production as well as our long-awaited first peek at Q3 2025 Consumption to see where they take us as the saga continues.
One of the places we also continue to look for more signals is in relative inventory levels, where an accelerating Inventory-to-Sales Ratio is bearish for Industrial Production and a decelerating ratio tends to be bullish. Recall that, after closing Q1 2023 at 1.38, Q2 took us slightly higher to 1.40 thus signaling that a local peak had yet to be reached and more inventory would have to bleed out of the system before we should expect any meaningful recovery in Industrial Production. When Q3 2023 closed at 1.37 and stayed there through Q4 and then Q1 2024 and still again in Q2, we got a little more signal that Q2 2023 may indeed represent that peak which would be strong confirmation that the fragile stabilization and eventual recovery in Industrial Production is likely to be sustained.
This argument was only strengthened with Q3 2024 once again closing at that same 1.37. Though we noted then that we’d have to see where future prints take us before getting too excited one way or another. But the lack of any real directional action on this indicator did make sense given what we saw from Industrial Production over the same period. Recall that we then got two somewhat constructive signals in the October print. Not only did preliminary Q4 hit the board at a slightly lower 1.37 vs. the prior month’s 1.38, the September revision took Q3 back down to 1.37 as well – making it the 5th consecutive quarter at that level. Geez, talk about stagnation. But with the final Q4 2024 print on the board at a slightly lower 1.36, we finally got some signal that surplus inventory is starting to burn off thus clearing the way for a recovery in industrial activity and ultimately truckload capacity demand. We noted last month that we “only hope that when IP does finally break, it breaks to the upside as opposed to the other direction – and the opposite for inventory-to-sales”. With last month’s update, that’s exactly what looked to be happening. But then the preliminary Q1 2025 print hit the board at a…you guessed it…1.37, putting us right back where we started. And as we noted last month, “with the level of accelerated imports we saw in January and February, it would be reasonable to expect this number to melt up even higher in the months ahead.” While that argument still sounds awfully logical, we didn’t get that with the February and March revisions. Instead, they took Q1 the opposite direction and down two points to close at 1.35. But now with our final Q2 2025 mark hitting the board at a slightly cooler 1.38 vs. last month’s materially higher revision to 1.39, we could finally be seeing that ‘melt up’ start to play out. At least that was before getting this month’s second revised look at Q3 with an updated mark at a still cooler 1.37, which for now at least pours a little cold water on the ‘inventory melt-up’ theory. But will it hold up through the next revision? Time will tell.
As we all know by now, the Inventory-to-Sales ratio historically runs inverse to Industrial Production, which makes sense as bloated inventory levels diminish the need to make more stuff to restock shelves. That means once we finally do observe a local top in the inventory-to-sales ratio, we should expect to see a local bottom in IP – and vice versa. So if a downward trajectory is sustained in the quarters ahead, it would represent an increasingly constructive signal for industrial activity, the demand for TL capacity, and the economy as a whole.
With recent Consumption, Industrial Production, and relative inventory levels all starting to show signs of potential reversal to the downside, let’s turn to our primary TL demand indicators – the Cass Shipments Index and the ATA TL Volume Index. Through most of 2023 and into Q1 2024, our chart patterns continued to post mostly Y/Y deflationary and pointing lower. However, from there, we’ve gotten more consistent signs of life. After closing Q4 2023 flat to the prior quarter at -8.6% Y/Y, the Cass Shipments Index appeared as though it had finally found a deflationary bottom – which was confirmed with Q1 2024’s -5.2%, Q2’s -5.3% Y/Y and Q3’s -2.8% Y/Y. And while Q4 2024 closed sequentially lower at -3.2% Y/Y, we remained well over Q4 2023’s -8.6% Y/Y inflection point – so the recovery continued. But that all changed with a preliminary January print that took Q1 2025 all of the way down to -12.5% and well beyond the Q4 2023 inflection point. At the time, we stated that “one month hardly makes a quarter. It was entirely possible that the January read was a weather-dampened anomaly and not representative of the quarter, but we wouldn’t know for sure until March got baked in. Until then, we were to remain cautious not to overreact one way or the other. But if we did somehow trend down at this level going forward, the fundamental shape of this current Y/Y inflationary leg of the new TL spot linehaul rate market cycle will be back in question.” We then went on to close Q1 at a materially stronger but still weak -6.3% Y/Y, landing decisively above our Q4 2023 inflection point. Then, with Q2 hitting the board at a much stronger but still deflationary -3.4% Y/Y, we were back to pointing up and to the right again. But the final Q3 mark coming in at a much lower -7.2% Y/Y, our trendline was once again back in question. But with that zig came the a new zag, with Q4 opening at a moderately stronger -5.8% Y/Y – still deflationary but back to pointing towards an inflationary recovery in the quarters ahead. Though as always, we’ll have to see where the next two revisions for Q4 take us before getting too excited one way or the other.
Our ATA TL Volume Index has followed a similar pattern as it tried to navigate its own cycle inflection. When our final revision for Q2 2024 hit the board at -2.9% Y/Y vs. Q1’s -5.2%, we got strong signal that TL capacity demand may have found a floor and was poised to improve in the months and quarters ahead. But with the final Q3 print on the board at a slightly lower -3.3% Y/Y, that signal got a whole lot weaker. Then our final Q4 mark hit the board all the way up at -1.4% Y/Y followed by a Q1 2025 at a still higher 0.0% and we were back on track with this TL capacity demand indicator as well. At least we were until the next quarter, when the index turned lower in Q2 at -1.2% Y/Y and continued to fade lower through our most recent preliminary Q4 print at -3.7% Y/Y – so no zag to be seen with this one just yet.
Suffice it to say, we’ll be paying close attention to see where Q4 revises as this particular dynamic takes center stage to potentially help explain what’s really going on in this market and where spot and contract rates are likely to head from here.
Now let’s shift our attention to the supply side and Net Class 8 US Tractor Orders where we had seen more positive developments through last year with a final Q4 2024 print of +3.4% Y/Y and a preliminary Q1 2025 mark of +4.9% Y/Y, taking us north of the x-axis and arguably back on track pattern-wise. But with the March revision taking the final close back to -18.2% Y/Y and decisively deflationary, so much for that. And with tariff uncertainty now tilting the consensus outlook for the economy ahead decidedly negative while the publicly traded motor carriers continue to underperform financially, it’s hard to imagine too many fleets taking big swings at new tractor orders. And with a Q2 number on the board at an off-the-cliff -42.8% Y/Y followed by a Q3 print of -20.7% Y/Y and a now revised Q4 at -33.0% Y/Y vs. last month’s -26.4%, that’s exactly what we got. We’ll have to wait to see where Q4 revises from here before getting too excited one way or another, but the industry reaction so far from these first waves of the Trump economic Triple Lindy (Increase Tariffs à Lower Taxes à Reduce Government Spending) certainly doesn’t inspire an awful lot of confidence. And those +25% tariffs on heavy-duty truck imports now in place certainly don’t help the supply-side buyers of those vehicles.
While Net Class 8 Tractor Orders have bounced around over the last two years, the roller coaster in US retail diesel prices over the same period has been arguably even more impactful to US TL market dynamics. After running -19.3% lower over the first half of 2023 ($4.714 to $3.802), we marched +20.0% higher in Q3 ($3.802 to $4.563), then reversed course yet again to fade -13.0% lower in Q4 ($4.563 to $3.972). From there, we faded another -6.3% lower to close June 2024 and Q2 at $3.722/gal before once again reversing the trend to move +2.4% higher in July to $3.810/gal. But with Q2 and now Q3 2025 behind us, the market has marched mostly higher for going on six months and currently sits at $3.758/gal through early December. While certainly not the whole story, this long-term slide in diesel prices over most of the past year has no doubt been one of the factors allowing otherwise unprofitable surplus suppliers to remain active in the spot market.
To zoom out a bit and further recap diesel’s wild ride for anyone who hasn’t been paying attention, the price of diesel had finally started to correct lower in mid-2022 after exploding steadily higher for much of the year up to that point – from $3.727/gal in January 2022 to $5.754/gal in June before retreating slightly to close September just barely under $5/gal at $4.993. This took the final read on Q3 2022 to +53.8% Y/Y after peaking at +70.7% in Q2. Unfortunately, however, diesel reversed once again to jump +5.0% (+$0.26/gal) higher through November to close at $5.255 on fears of a US diesel shortage driven by diminished refinery capacity in the northeast. Ultimately, those fears proved to be unfounded as diesel instead reversed course once again and ran -27.7% lower to June 2023 at $3.802/gal and a Q2 average of -28.1% Y/Y. But just when we were starting to lose interest, July came along and initiated the reversal in trend that took prices steadily higher through September and $4.563/gal. It proved to be short-lived however, with yet another reversal that looked temporary at the outset but only picked up steam – with May 2025 closing -23.3% lower from the September 2023 high mark despite brief turns higher in July, October, January, and February. From there, however, June 2025 closed 10 cents higher (+2.9%), July another 18 cents higher, and has since settled two cents lower – for a cumulative increase of +9.2%. So with momentum swinging from month to month while 2025-26 global energy forecasts continue to diverge, it is hard to say where diesel goes from here in the short term especially given the conflicts still raging in the Middle East and Ukraine, disruptions in the Red Sea, and the shifting demand outlooks for both the US and China given new concerns around tariffs, trade policy, and government spending.
As noted in past issues and repeated here for any new readers, the last time we saw anything like 2022’s spike in fuel prices was in 2008 when diesel climbed to +66.6% Y/Y that June – in the throes of The Great Recession. During that particular US TL Spot Linehaul Rate Cycle, unlike this one, diesel spiked higher several quarters ahead of spot and contract rates. As a result, we saw an unprecedented wave of motor carrier bankruptcies and exits as profitability was violently wiped out – especially for those most exposed to the spot market. The key difference this time around is that spot and contract rates led diesel by several quarters, which allowed the market to absorb the diesel shock without forcing carriers out of the market in material numbers at the same rate. And so far at least, it has been a much more gradual exit. As the battle between spot market rates and carrier operating costs rages on, the role that diesel prices have played has been in helping to set the ultimate market bottom where our Y/Y US TL Linehaul Spot Index line finally inflected higher as sufficient surplus capacity has been forced to exit as their operating margins evaporate. And as noted here, we believe we found that bottom with the confirmation of Q1 2023 as our deflationary inflection point. Going forward, diesel’s role remains that of a pacesetter. If prices change course to move higher, then the pace of exits likely accelerates a little. Should they continue to fade lower, all else equal, then the pace of exits likely slows which would be a headwind for TL spot rates and would slow the overall market recovery towards its next Y/Y inflationary peak.
So here we sit with a revise Q4 2025 print on US TL spot linehaul rates at +2.9% Y/Y and the sixth consecutive inflationary mark in a row. Consumption is still flashing mostly positive signals while Industrial Production and Relative Inventory levels show promising signs of finally breaking out of prior patterns to more constructive upside trajectories. So what’s going to move the needle on Spot TL rates one way or the other in the month ahead? As we’ve noted since the March issue, “with the haymaker of an announcement on Liberation Day April 2nd of incremental tariffs on every country that imports into the US, trade policy now takes center stage as the leading catalyst for where both the trucking market and the broader US economy go from here.” And that remained the case through last month. But this month, pole position goes to the rate of supply exits from new regulatory pressures on non-compliant CDL/immigration/EPL drivers and the carrier that employ them. Though as with last issue, we have diesel prices stepping into the spotlight as well with the first Y/Y inflationary quarterly print in over two years at +1.7% Y/Y for Q3 and now +6.2% Y/Y in Q4 through this first week of December.
While we continue to expect that the unstoppable force that is the US TL Spot Linehaul Rate Cycle indeed stays undefeated over the long term, we can’t ignore the recent relative weakness and the “off-pattern” kink we now have confirmed on the board for the last three quarters. If Q4 ultimately closes higher than Q1’s +2.4% Y/Y (which we are currently tracking to do), then a “kink” will likely be all that this irregularity is viewed as. If not, then the fundamental shape of the cycle going forward could be in serious question – of course, depending on what diesel does and the non-domiciled CDL and EPL crackdowns now in progress. So with all of that said, let’s break down our list of freight market wild cards for the month ahead, with non-compliant driver and carrier exits stepping into the #1 spot, tariff-driven consumption and industrial activity distortions falling to #2, and the Atlantic Hurricane Season officially stepping off the podium as we got another mostly benign year of disruptive storm activity:
1. Non-Compliant CDL/Immigration/EPL Driver Crackdown: We believe that the increasing scrutiny on non-EPL or CDL-compliant drivers will accelerate the exit of non-conforming drivers and fleets that currently employ them, and could represent the most meaningful supply-side catalyst in the last ten years as market labor policies evolved in response to the relentless, and wrong, driver shortage narrative. This is a big deal, and could finally explain one of the driving forces behind both the magnitude and the duration of the 2022-2025 freight recession.
2. Global Trade War/Tariffs Impacts: As noted throughout the last few issues, given recent escalations in what had been a simmering trade war between the US and the rest of the world, the longer that tariff-based trade barriers remain raised, the more destructive the short-term impact is likely to be. While we had expected rapid resolution across a wide swath of the newly burdened trading partners (Vietnam, Cambodia, Israel, etc.), it was the path forward with Mexico, Canada, China, and the EU that move the needle the most on this front. And as a couple of these agreements continue to get hammered out, it is becoming quite obvious that double-digit import tariffs look to be the new normal – assuming the US Supreme Court doesn’t overturn them. If Consumption levels are able to hold onto the strength they had shown through last quarter, then spot truckload rates likely tilt higher on the back of an increasingly depleted supply base and a softening of trade barriers. If not, then we could see the spot market continue to bounce along equilibrium at a range-bound at 0.0% + 5.0% Y/Y through much of 2026.
3. Diesel Prices: As noted, now that we’re well beyond our Y/Y US TL market cycle bottom, we believe that diesel prices in the months ahead will help set the pace at which spot market rates continue to recover from here. While prices have been on a bit of a roller coaster ride over the last two years, we suspect that the downtrend we got through the first half of 2023 and again over most of the last 18 months, only prolonged our time down here at the bottom of the cycle. The lower that diesel went, the lower the market allowed Spot linehaul rates to go. After declining steadily by an aggregate -27.7% from November 2022 through June 2023, diesel reversed and marched +20.0% higher from there to September 2023 before reversing again to fade -23.3% lower to May 2025 $3.499/gal. Though from there, we have since bounced +9.2% higher through December’s $3.758. If this recent upward trend is sustained and we continue to head materially higher, we should expect the pace of carrier exits to accelerate even further (all else equal), in stark contrast to most of the last year and a half – notwithstanding the impact of tariff-driven market distortions.
4. TL-Intensive US Consumer Spending: Consumer spending (as a proxy for future TL capacity demand), also somewhat of a derivative of the tariff wild card but we’ll keep separate for now, bumps back down a notch. Conditions remain tough to say the least for the average US Consumer, despite ample signal that peak Consumer Price Inflation (CPI) is well behind us after many months of slow yet uneven sequential decline. After correcting all the way from June 2022’s +9.1% Y/Y to June 2024’s +3.0% Y/Y, we have continued to fade mostly lower at prices further stabilize – with September 2025 on the board +3.0% Y/Y. And with the Price Index for Personal Consumption Expenditures, the Fed’s preferred inflation metric, also fading mostly lower in recent months (+2.8% in September 2025), we are seeing mounting evidence that perhaps this time a ~ 3.0% CPI environment could potentially stick around – at least that was the case prior to the aforementioned trade war. Now all bets are off, and it will continue to be the Consumer’s ability (or not) to endure potentially even stiffer headwinds should tariff-induced inflation materialize that determines where the economy and the freight market go from here.
With the prior cycle still firmly in the rearview mirror (though perhaps not far enough), we can look back and reflect a bit despite the increasingly uncertain path in front of us. While the deflationary leg indeed took us far lower than those that came before (-31.8% Y/Y vs. last cycle’s -19.0%), it also took us two quarters longer than the seven-quarter deflationary leg of the last cycle (Q4 2018-Q2 2020) and the seven-quarter deflationary leg of the cycle before that (Q3 2015-Q1 2017). So, incredibly challenging market conditions for sure for most of those on the supply side, but hardly ‘unprecedented’ or ‘generational’ in nature – even considering the lower low and the longer duration. And if this cycle was more like past cycles than it was different, we should be able to anticipate typical market behavior as this Y/Y deflationary leg slowly but surely came to a close and the Y/Y inflationary leg of the new cycle began – and then recommend how best to position. So as outlined in recent issues and revised here for all of you first-time readers, we recommend some version of the following for both supply-siders and demand-siders as we continue to limp out of the gates of this new cycle.
For motor carriers and brokers operating on the supply side of the market, this likely means keep doing what you’ve been doing over the last year and a half – at least if that means cutting costs, getting leaner, and conditioning your teams to be able to do more with less. While we absolutely see the light at the end of the tunnel with some version of the beginning of a recovery in spot TL linehaul rates already in motion, the market correction is virtually guaranteed to be uneven – with different industries, geographies, and equipment types all evolving at their own pace. Also, as noted last month, while the rate of recovery can look pretty dramatic on our Y/Y cycle charts, the sequential development of the market rates each of us experiences will feel altogether different. For example, even if spot rates found a way to go on to close Y/Y inflationary in Q1 2026 at +10.0% Y/Y as revised down last month, that only represents a +11.1% increase from current levels.
And with the Q1 TL Contract Linehaul (Cass) Index breaking Y/Y inflationary at +1.4% Y/Y for the first time since Q4 2022 and Q4 opening flat to Q3 only slightly higher at +2.0%, its trajectory from here was recently revised slightly lower as well. But regardless of the ultimate pace at which the market trends Y/Y inflationary over the quarters ahead, there is little downside in remaining disciplined and pursuing operational excellence in whatever it is that you do – especially now that conditions just got a lot more challenging with the great economic reset. As you prepare for the balance of 2025, the months ahead represent a welcome opportunity to refine your commercial strategy and carefully consider the shippers that you want to partner with going forward into the next cycle. So hopefully you are choosing wisely, as those who navigate the cycle most successfully over the long run tend to be the ones with the most durable long-term commercial relationships with partners that have earned their trust through both the ups and the downs.
And for shippers on the demand side of the marketplace (and brokers that operate on both sides), our guidance is similar. While the most recent Y/Y deflationary leg of the cycle has technically ended, the months ahead represent a tremendous opportunity to recalibrate your transportation strategy for the Y/Y inflationary leg that had just begun pre-trade war. The race to the bottom of the TL market that you have enjoyed up to this point is mostly over, but its lingering impact is almost certainly masking weaknesses and deficiencies that will take a toll next year if left unaddressed. So now is the time to examine your current and projected freight flows to understand where alternative modes, operating models, and capacity partners could create a comparative advantage – whether it be from cost, speed, utilization, or flexibility – in an inflationary TL market or one made all the more volatile with evolving trade conditions. With the cost of capacity increasingly on the rise, the penalty for waste only increases from here. So, focus on filling your trailers and intermodal boxes, or find a way to only pay for the space you need (the cost for shipping air is likely going up, not down!). And work to eradicate empty miles and excessive dwell times from your networks. Remember that 2026’s winners will be determined by the actions taken now. Aspire to be considered a ‘Shipper of Choice’ throughout the cycle, not just when the financial pressures of an inflationary rate environment force your hand.
From our current revised mark of +2.9% Y/Y, we continue to expect to close Q4 2025 well under the lower end of prior range (+10.0% Y/Y) and closer to +5.0% but to run increasingly inflationary, albeit at a more tepid pace as expected prior to the trade war, as we kick off the next three-to-four-year US trucking market cycle. We continue to forecast contract linehaul rates, after breaking Y/Y inflationary in Q1, to run higher to close 2025 and into 2026 as primary tender acceptance rates deteriorate, routing guides spring leaks, and freight contracts are reset through a flurry of mini-bids – just like in 2017 and 2020-21. Though now expect this to get accelerated even further as transportation networks are increasingly thrown into tariff-driven disarray and diesel prices march higher. Regardless, we hope that this time around, the industry and its trading partners will have more effective tools at their disposal to make better use of the capacity that already exists in the market (across all modes) such that the supply side won’t be baited into overshooting to the same degree as in cycles past. And that the dramatic volatility of this market can begin to be tamed such that we’re not all doomed to a future defined by higher peaks and lower troughs. But until then, the roller coaster must unfortunately continue.
So just as all looked to be tracking a year ago for a Q1 2024 that marked the end of a long and painful (if you’re on the supply side) deflationary freight recession coming out of January, the supply side somehow found a lower gear and took US Spot TL Linehaul rates all of the way back to their 2023 lows and well below estimated operating costs per mile. In fact, our models estimate that all-in spot TL rates have been unprofitable for the average US motor carrier since Q2 2023 with recent levels at the lowest we’ve seen since the great recession and financial crisis of 2007-09 – with only moderate improvement in 2025 until only recently. We now attribute this primarily to an increasingly large carrier cohort with the labor wage flexibility to operate at lower costs as compared to their market peers – which we expect to see the regulatory landscape begin to help accelerate a material recalibration in the months ahead. So while we continue to believe that, at this point in the cycle, the attrition of unprofitable capacity will be enough to tip the market to a state of relative supply scarcity and therefore an increasingly Y/Y inflationary spot linehaul rate environment in the quarters ahead, even in the face of a self-induced US recession, that alone won’t likely surge rates to the levels seen in last cycle’s Q2 2021 +56% Y/Y peak. Instead, we’d probably be looking at something closer to the +25-30% Y/Y peak we saw during the 2007-2009 financial crisis.
To correct any higher than that, we would need a material recovery in TL capacity demand and therefore US industrial activity – as noted a couple of issues ago before the most recent tariff shots were fired. Though whatever may come to pass, we still don’t expect the fundamental shape of the cycle to change a whole lot given how little has changed in the fundamental structure of the trucking market. It’s still really big, still really fragmented (if not more so), and still forced to make long-term supply decisions in silos based on near-term information and bias. And now that the inevitable buy-side freight market winter is upon us, even if conditions have eased in recent months, market conditions should finally support at least some version of a sustained supply-side rate recovery in the quarters ahead. We just might not like how we get there if it’s primarily on the back of supply-side attrition as opposed to rising demand for spot and contract truckload capacity.
But as the market and the world continue to turn, the US government steps in to “help”, and unstoppable forces collide with immovable objects, it’s important that everyone maintains perspective and focuses on the things they can control. Though we know that’s often much easier said than done. All of the operating improvements and efficiencies gained over the recent Freight Recession will pay off regardless of market conditions – whether they be driven by technology, talent development or strategic core carrier or shipper programs…so long as you’re still alive and in the market when we finally do come out the other side. Building velocity, flexibility and nimbleness is about as much of an all-weather strategy as you can get. So for those that came into 2025 prepared to be lean and agile, you should feel confident in your ability to navigate whatever comes next and outperform your competition. For those that didn’t, it’s never too late as “wait and see” will eventually cease to be a viable strategy as this trade war escalates further. But as always, this too shall pass – it’s just taking an awfully long time this time around. And as the market forces that led us to the current state of the driver population and supply base get reshaped by regulatory enforcement in the months ahead, we don’t expect this unprecedented period of sustained market equilibrium to last much longer – which should make for a wildly volatile 2026 as the rate cycle finally catches up. Now that we better understand all of this, we should be in a much better position to predict where go from here as all of these market dynamics evolve. And from what we can see at this point, things are about to get a lot more interesting out there. Cheers to a happy and healthy holiday season, and a prosperous 2026…regardless of where the freight market and the rate cycle take us.