
[Excerpt from The Pickett Line April 2026 Issue]
Well, are we having fun yet? It’s hard to believe we’re already half of the way through 2026, yet here we are. From winter weather to an “on again-off again” war in Iran to a potentially market-moving Supreme Court decision on broker liability (drink every time a freight person says “SCOTUS”!) and a regulatory agency with a newfound spine, this year has already had it all. It has just all been jammed into a mere six months. Just looking back over the themes of the 2026 catalog published so far is enough to make one’s head spin. Though in retrospect, we do think we captured the zeitgeist of the market quite well each month from a play-by-play perspective. So let’s break it down for those who haven’t been keeping score from home since January. Here’s what we’ve faced:
January (Nov ’25 issue): And so it begins.
February (Dec ’25 issue): March of the lemmings.
March (Jan ’26 issue): Adding fuel to the fire.
April (Feb ’26 issue): It’s the cycle, stupid.
May (Mar ‘26 issue): Order in the court.
Just from those five 4-5 word blurbs alone, you can almost feel the mounting tension and drama that has built steadily with each passing month. That said, for anyone out there reading this that wasn’t in or around the US truckload freight market in 2020…or 2017…or 2013…or 2010, this is kind of what an inflationary cycle transition is supposed to feel like. The gradual rebalancing of supply vs. demand over the last couple (or 4 in this most recent case) of years has gone largely unnoticed as spot rates remained historically low, freight budgets performed as planned, and contract routing guides went mostly unchallenged. But then a phase change occurs (much like gas-to-liquid or liquid-to-solid state transitions in physics), where a tipping point is inevitably reached, and the market state flips from relative supply surplus to supply scarcity.
This transition is often obscured by other market forces like seasonality or weather, such that by the time enough of the market realizes the market has flipped at all, we’re well into the inflationary leg of the new cycle. And ladies and gentlemen, this is where there is no shortage of strong opinions broadly expressed that look to pin the root cause of the market turn to whatever is happening in the economy or the world at that moment in time. So the last few months have certainly been no exception. First, it was winter weather in the Midwest and the East. Then it was non-domiciled CDL crackdowns, followed by DOT enforcement of English proficiency requirements during inspections. Wait, or did ELP come first? Then it was the rapid rise in diesel prices stemming from the war in Iran and the closure of the Strait of Hormuz, followed by the SCOTUS (drink!) ruling in the Montgomery vs. Caribe Transport case on broker liability for carrier selection.
We also begin to hear new terms for this well-documented sequence of market transitions that has repeated consistently over at least the last 20 years that we have had the data available to measure them: terms like “super cycle” or even “mega super cycle”. Though to be fair, who are we to throw stones? As even the most earnest and grounded team of analysts and writers here at Pickett Research have found it impossible to resist the force of narrative hyperbole from time to time to make the gravity of current market conditions relatable and interesting for the audience…as demonstrated by the ‘The Saint Valentine’s Day [freight market] Massacre’ issue from February 2024. A massacre? Really? In any case, the point is not to be led astray by the sentiment that “this time it’s different” when faced with a seemingly dramatic shift in the balance of the US truckload freight market. As once the inflationary transition gets going (like where we are now), every temporary market dislocation or disruptive force is going to feel like the “thing” that is driving spot market rates higher. But eventually the “thing” clears or is somehow reconciled, usually by the passage of time, and you’re left wondering why spot rates haven’t moved materially lower as a result.
But with all of that said, of course all of the “things” do matter to at least some degree and are worthy of interrogation in the spirit of better understanding the likely direction and pace of the spot and contract linehaul and all-in rates in the period ahead. And in that spirit, we’re going to unpack what we believe to be the next “thing” worth paying attention to, and have aptly titled this June (Apr ’26) issue: The next shoe to drop.
In what could be one of the greatest twists of irony in recent memory, we believe the next inflationary shoe to drop could actually be a rapid decline in diesel prices. Huh? Isn’t tanking diesel (pun intended) supposed to be a deflationary force for spot and contract rates as it lowers direct operating costs for most asset-based motor carriers? Yes, over the long-term it has proven to be just that. But at this moment in this particular cycle, it could serve as a catalyst for the exact opposite. Hear us out.
From when the war in Iran broke out on February 28th through the month of May, national diesel prices surged by +50% or $1.88/gal to $5.60. Over that same period, implied DAT Spot Van linehaul (ex-fuel) rates increased by +8% to $2.16/mi. We say “implied” because truckload capacity trades primarily on an “all-in” rate basis in the spot market. The linehaul rate is only derived by subtracting the DAT fuel surcharge (FSC) amount based on their published FSC table. All-in (with fuel) Van rates surged by +20% to $2.89/mi.
By comparison, the implied DAT Contract Van linehaul rate increased by a much lower +3.8% to $2.20/mi and Contract Van all-in rates by an also much lower +15.8% to $2.93/mi. So through the month of May, even with the surge in the TL spot market, all-in DAT Contract Van rates remained moderately to slightly higher than all-in Spot Van at $2.93 vs. $2.89/mi. So if Contract shippers were wondering what all of the fuss was about because their routing guides were mostly holding up, they were right to do so. Up to that point, there likely wasn’t enough of an all-in rate premium in the spot market for contract carriers or brokers to warrant shifting material capacity there, which would require eroding their service performance on that contract business and risking the Shipper relationship.
All of that changes in an environment where spot rates are trending higher while diesel prices are dropping like a stone – which is exactly where this market is heading if the market consensus for diesel prices in the months ahead proves accurate. In contrast to the spot market, contract rates are typically negotiated on the basis of linehaul rates ex-fuel, with a fuel surcharge (FSC) component tied directly to the national average or “over the route” price at the pump. So when diesel prices move beyond a few cents per mile in either direction, depending on the FSC methodology employed, all-in contract rates move accordingly. There is no negotiation, just a math equation. So if the only thing that has been keeping all-in contract rates at relative parity with the spot market is the surge in diesel, and that’s the only thing keeping contract routing guides mostly intact, then you can probably see where we are going with this “next shoe to drop” hypothesis.
If, as projected, much of the +50% surge in pre-war diesel prices is rapidly unwound in the months ahead, just as the market enters its summer surge in seasonal demand, we could see a pretty meaningful divergence higher in Spot vs. Contract Van all-in rates. And when that happens, it would be reasonable to expect a material decline in primary tender acceptance rates across many Contract routing guides, which would likely push a lot of contract freight into the spot market – at least temporarily, as that freight is eventually re-priced at higher contract rates. But in the meantime, we could see enough of a surge in seasonal spot market volume to compound with this unplanned contract-to-spot volume reallocation such that all-in Spot Van rates accelerate higher as a result. Linehaul Spot Van rates will almost certainly surge higher as a result, because again this is just an implied calculation based on what is likely to be a rapidly declining FSC adjustment. And as a result, we’ll get a subsequent surge in mini-bids and contract re-pricing events through much of Q3. And all because diesel fuel is set to get a lot cheaper…go figure. What a market. We’ll unpack it all in this special “The next shoe to drop.” April 2026 issue of The Pickett Line.
Now with Q2 2026 just about to fade entirely into the rearview mirror, we continue to marvel at the stoic consistency of the US truckload freight market cycle. While truckers, shippers, and brokers all endured disruptive winter weather across much of the country in January, an AI panic-induced flash crash in February, then a historic spike in diesel prices starting in March, and now a SCOTUS ruling almost nobody saw coming, spot linehaul rates marched right along in line with our forecast – at least directionally. We closed Q4 2025 at +4.6% Y/Y vs. a forecast of +5.0% before heating up to +18.0% Y/Y in Q1 2026 vs. a forecast of +10.0%, and now sit at +33.9% Y/Y vs. a forecast of +25.0% with a week and a half left to go in Q2. While it seems we can’t go a week without a new inflationary catalyst popping up for the market to point to as the explanation for the trending rate environment, our position continues to be that this is all absolutely playing out as expected with regard to past rate cycles. Because if nothing has fundamentally changed in terms of market structure or supply vs. demand dynamics, the cycle has little choice but to repeat.
And, as noted in recent months, as much of the market narrative continues to obsess over whether the market turn is sustainable or if rates will come crashing down when the US/Israel vs. Iran war is finally settled and the Strait of Hormuz returns to pre-war throughput levels, the more forward-thinking and better-informed demand and supply-siders (like The Pickett Line subscribers reading this right now) have already made moves in anticipation of spot line haul rates heading toward +60% Y/Y by the end of the year and contract linehaul rates topping +15.0% by mid-2027 – which is where we are revising our forecast to this month from +45.0% and +10.0%, respectively. And it won’t be because of whatever happens with diesel prices between now and then. Or whether or in what form Dalilah’s Law eventually passes, though it can’t happen soon enough in our opinion. It will be because the surplus capacity that entered the trucking market in 2020-2022 has finally been forced to exit in sufficient magnitude to tip the spot market Y/Y inflationary – the same thing that happened in 2020, 2017, 2014, and 2010. Remember, “it’s the economy cycle, stupid!”
Now let’s get to work parsing last month’s macro data points and market signals to show what makes us so confident in charting the path ahead, in this special “The next shoe to drop.” April 2026 issue of The Pickett Line. Now just about all the way through the second quarter of this new year, we continue to see compounding signals lining up in support of the assertion that, after three full quarters of battling through the downdraft in US truckload capacity demand triggered by the Trump Trade War, the 6th observed turn of the US TL Spot Linehaul Rate Cycle has returned to its regularly scheduled program. Last month, we got Q1 diesel prices bending to +11.6% Y/Y. The month before that, it was an inflationary surge in Net Class 8 Tractor Orders snapping back to pre-COVID patterns. And now this month, in addition to both diesel and Class 8 patterns continuing, we get relative inventory levels flashing a still lower 1.31 to open Q2 after three years of 1.36-1.40 prints. In fact, we have to go all the way back to Q3 2022 to find a lower mark. We also got both preliminary Q1 2026 Consumption and Q2 Industrial Production inflecting higher, and one of our TL capacity demand indicators (ATA TL Shipments Index) breaking Y/Y inflationary for the first time since Q4 2022. In fact, this is the second month in a row (last month was the first we could recall in a long time) where every single one of our indicators is flashing green. We’ll have to wait to see how many of these hold up through subsequent revisions, but as it stands, we continue to get signals that Demand is poised to become much more of a factor in what has up to now been a mostly supply-driven market rate story.
You may recall that this new cycle technically began way back in Q3 2024 with the first Y/Y inflationary close of the spot index since Q1 2022 but was unexpectedly snuffed out on Liberation Day and then the hostile tariff antics that have since followed. Since then, the accelerated exit of unprofitable (and in many cases non-compliant or illegally operating) carrier capacity has finally overtaken those demand headwinds, spiking the final Q1 2026 mark to +18.0% Y/Y vs. the prior quarter’s +4.6% Y/Y and a forecast of +10.0% Y/Y + 5.0% – to at least some degree making up for the last few quarters of stalled momentum.
We noted a few issues ago that halfway through February, “spot linehaul rates had proven to remain stubbornly high for that time of year – with our revised Q1 mark currently sitting at +20.3% Y/Y vs. a forecast of +10.0% + 5.0%. While we continued to expect rates to fade at least somewhat lower in the coming weeks as some winter weather clears, we don’t believe we’re headed all the way back to November 2025 levels. Instead, in direct support of this new cycle kicking off, we believe that the market is in the process of setting a new rate floor as marginal supply continues to exit and the floor on driver wages begins to reset higher as a result”. With the Q1 closing where it did, that’s pretty much what we got. And now most of the way through June, we’ve got a revised Q2 mark of +33.9% Y/Y vs. a forecast of +25.0% Y/Y + 5.0%. So we remain right on track with regard to market guidance, though this month we are taking our forecasted cycle peaks from +45.0% to +60% on Spot and +10.0% to +15.0% on Contract.
Also as noted in recent issues, it is important to keep in mind that the spot market, based on estimates from the annual ATRI Analysis of the Operational Cost of Trucking, has been unprofitable for the last 11 quarters, which while unprecedented over the last decade, couldn’t last forever. So what we think we’re witnessing is the inevitable reckoning, just accelerated by increased regulatory scrutiny around immigration status, non-domiciled CDL compliance, and the English language proficiency of drivers. And with a spike in diesel prices adding fuel to the proverbial fire over the last 3-4 months (but set to reverse), the pace of the reckoning will only increase. And while the magnitude of these projections has probably appeared absurd for those using other forecasting approaches, they are entirely within the range of what we observed in past cycles. If anything, barring a material and currently unexpected downturn in the broader economy in 2026, this could prove to be conservative – as implied earlier with our commentary around spot rates potentially seeing +60-70% Y/Y and contract touching +12-15% Y/Y at peak and still operating within range of historical patterns.
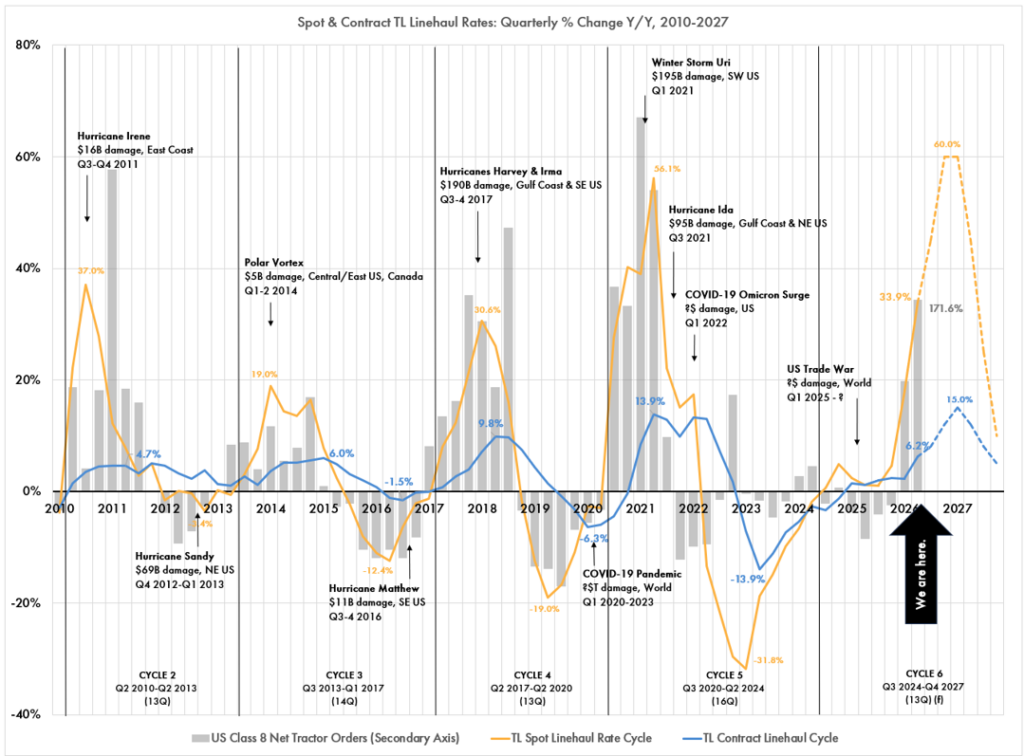
So with our forecast lines moving materially higher this month on both Spot and Contract linehaul rates, we are once again sticking with last month’s ‘Chart of the Month’ for another turn. After the last few months of highlighting a chart showing the estimated motor carrier profit per mile in the spot market through the rate cycle, illustrating just how bonkers the last few years have been, we’re switching gears back to the main event – the US TL Spot and Contract linehaul rates themselves. In the spirit of “the more things change, the more they stay the same”, this month’s chart goes back to 2010 for a longer-term view of just how durable these year-over-year patterns in spot and contract linehaul rates have proven to be.
And just how correlated the level of year-over-year US Net Class 8 Tractor Orders had been, until COVID-related and then freight recession-related distortions came along and kiboshed things. But with the final Q1 2026 mark coming in at a monster of a +99.2% Y/Y and back in apparent alignment with the early inflationary leg of this new rate cycle, we thought it noteworthy enough to highlight last month. Though to remain in line with historical patterns, we noted last month “that means we would expect to see a Q2 mark coming in well north of +100% Y/Y. Given last year’s especially weak Q2 comp, we don’t think that’s going to be such a tall order. But as is always the case, we’ll all have to stay tuned to find out.” Well, with our second glimpse at Q2 now on the board at +171.6% Y/Y, we can clearly check that box. And with so much drama setting up around these early chart correlations, we suspect this particular ‘Chart of the Month’ likely has a few more issues to run before losing the throne.
So in the chart below, we show four full turns of the US TL Linehaul Rate Cycle (2-5) and the early stage of this current Cycle 6. We also note specific market-moving events that we observed to have dislocated supply vs. demand enough to impact the average quarterly spot rate as a result. One observation would be that you see more of these events showing up on the Y/Y inflationary side of the ledger. Not because there weren’t storms or other disruptions during the Y/Y deflationary legs of the rate cycle, but because they were much less likely to be market-moving. When there is surplus relative capacity in the market, it’s a lot easier and more efficient for the market to recalibrate and adapt to a dislocation event, so rates tend not to spike as a result. This chart then implies that over the next two years, with the market in a stage of relative supply scarcity, it will be much more vulnerable to inflationary dislocations. Which means that as these dislocations inevitably occur, there will be no shortage of freight media headlines to drive spirited debate among well-informed market pundits – or at least a lot of clicks to drive digital ad revenue as we all continue to take the (click)bait.
While we are moving on (for now) from spotlighting motor carrier profitability (or lack thereof) as the primary driver behind capacity flowing into and out of this increasingly fragmented +$900B industry, we did want to retain the main points of the narrative for any new readers this month. Feel free to skip ahead if that’s not you.
Recall that in recent issues we highlighted a chart that showed the estimated motor carrier operating profit per mile through the US TL Linehaul Spot Rate Cycle going back to 2007. When the bars were in the black, that means that all-in TL spot linehaul rates (including fuel) exceed the average estimated operating cost per mile as reported in ATRI’s annual ‘An Analysis of the Operational Costs of Trucking’ report. And when the bars were in the red, where the market had been going on 11 quarters, those operating costs (which include fuel, driver wages and benefits, lease costs, insurance, tires, tolls, etc.) exceeded the national average all-in rate per mile that the spot market is paying.
First, consider that fuel and labor historically account for 60-70% of operating costs for the average US motor carrier – as reported by ATRI based on the carriers that respond to their survey every year. So over two thirds of the operating expenses that compare with all-in spot market rates to form the black or red bars in the featured chart are from these two costs alone. Historically, it had been our understanding that the cost of labor doesn’t change all that much on a year-to-year basis – at least as compared to diesel prices which showed greater levels of volatility over the years and which often had a direct impact on spot market freight rates. So we tended not to focus much on labor costs and assumed that, while there were no doubt differences in those costs based on region or equipment/fleet type, the market as a whole tended to have mostly comparable labor costs on a year-to-year basis.
That said, it is widely understood that owner-operators or small fleets where the owners are the ones behind the wheel, tend to have a lot more wage elasticity than larger carriers or private fleets with hired drivers. And that cost structure could allow them to operate at moderately lower freight rates than their larger competitors without going bust – for at least some period of time. And partially as a result of that, the observation had been made that a cohort of carriers clearly still existed that had found a way to profitably operate at ~$1.50/mile.
So how were they doing it? As outlined in recent months, we now believe the answer is twofold. One, just the sheer magnitude of the surge in operating authorities granted and therefore new MCs entering the market during the COVID and post-COVID boom years of 2021-24, while a number of larger fleets like Davis Express and 10 Roads have been forced to exit, suggests that the market has trended towards more fragmentation not less – so relatively more owner-ops and small fleets with more flexible cost structures than in past cycles. But we think the real story could stem from the relative rise in the cohort of non-domiciled Class A CDL drivers through the COVID cycle – accelerated by loose immigration policy and material weaknesses in the CDL examination process itself in states like CA, TX, PA, and IL.
And this dynamic is what we now believe could be the smoking gun that explains both the depth and the duration of the last freight rate recession. Left to its own devices, we believe the market would still eventually grind through its normal Darwinian process of weeding out unprofitable surplus supply over time – albeit at a much slower pace than in the past, something we have all experienced directly over the last few years. Consider that prior to 2015 when many state non-domicile CDL programs were expanded, deflationary market corrections took on average three quarters to move from their deflationary inflection point back to equilibrium. The 2016 recovery took four quarters, which was followed by a 2019 recovery that took five quarters. The 2022-24 recovery took six, before going on to stall out and hover at < +5% Y/Y for another five quarters. So while the foundational battle between supply and demand that governs overall cycle dynamics remains intact, something clearly appears to have evolved that has stretched the duration of our corrections. And we believe that “something” is materially increasing relative labor wage flexibility driven by the increasing level of fragmentation overall, but more so by the increasing proportion of non-domiciled CDL drivers out in the long-tail of owner-op and small fleet capacity.
We make no claims here around the skill, ability, or safety record of the non-domiciled and/or non-ELP-compliant CDL population relative to their US-domiciled counterparts. And while it’s hard to argue that non-English speaking or reading drivers don’t pose a potential safety risk to US highways, whether that has proven to be the case over the years may be unknowable. That said, none of that really matters with regard to this particular argument. The fact that ELP regulations are now being enforced during DOT inspections, the immigration status of Class 8 truck drivers is being screened at highway and facility checkpoints across the country, and non-domiciled CDL programs are being scrutinized, if not shut down altogether, will immediately begin to reverse these driver cohort trends – both by putting more drivers out of service and by making it more difficult if not impossible for new non-domiciled labor to enter the market in the first place going forward. Or in other words, the market will not be left to its own devices in the quarters ahead as spot linehaul rates seek to correct higher. An evolving regulatory landscape is going to pressure the supply-side recalibration by accelerating the exit of what we propose is a cohort of drivers and carriers that, up to this point, have been willing and able to run at materially lower labor rates than the broader market.
And that is the insight that had eluded us over the last year or two as we struggled to understand and explain why it has taken so long for the market to break Y/Y inflationary (and stay there) from its last deflationary inflection point all the way back in Q1 2023. But with market forces, in the form of federal regulatory scrutiny and now materially greater liability risk for brokers, now in place to accelerate the reversal of this trend, we expect future cycles to look a lot more like those that we observed prior to the most recent COVID and Russia-Ukraine distorted one that we are still trying to break free from. In the meantime, we now understand the extent to which the supply side has evolved over the last twenty years as a result of immigration policy and the ill-advised and ultimately untrue driver shortage narrative. So getting to more accurate and complete data on the segmentation of the estimated 3.5 million Class A CDL truck drivers that comprise the supply side of the market is going to be increasingly important when it comes to forecasting the shape of the rate cycle going forward. But we believe we are closer to understanding it now.
So with Q1 2026 closing mostly on-guidance (albeit materially hotter at +18.0% vs. an upper forecast range of +15.0%) and a revised Q2 2026 hotter than forecast as well at +33.9% vs. +25.0%, what does the current market trajectory mean with regard to expected market behavior? How are buyers and sellers likely to behave? As noted in recent issues and summarized again here for any new subscribers, with the projected spot market cycle well into inflationary territory, many enterprise procurement teams have logically looked to extend the duration of their current contracts to try and ‘keep rates locked in at the bottom’ for as long as they can get away with – which never really works over the long term yet represents a short-term temptation that is often difficult to resist. We estimate that through the duration of the most recent inflationary leg of the rate cycle from Q3 2020 to Q1 2022, TL spot linehaul rates ran at an +18.1% premium (or penalty if you’re on the buy-side) to contract rates – with the first two quarters representing the worst of it at +20-23%. This compares to an average premium/penalty of +10.4% during the last inflationary leg before that (Q2 2017 to Q4 2018), so cycle amplitudes have clearly increased, thus amplifying the relative penalty cost of the spot market altogether during this phase of the cycle.
Regardless, we should then look for many contract routing guides to begin springing leaks in the months ahead as primary tender acceptance rates continue to fall back towards 2020-21 levels – and likely to get much, much worse in an environment of rapidly dropping diesel prices and the FSCs that account for them in contract rate agreements. That said, all is not lost if you are one of those procurement teams that run this playbook, usually under duress from a finance organization or executive leadership team looking to drive operating costs lower by any means necessary – especially as tariffs continue to bite and energy costs rise. You’ll just need to be especially agile as the freight market landscape shifts in the quarters ahead. To that end, if you haven’t done so already, we recommend that (if able) you invest in the technology and tools required to give your team the visibility and control they need to track the performance of your contract lanes and carrier partners on at least a weekly basis, and then be in a position to take decisive action if necessary – from rebidding lanes away from underperforming vendors to procuring surplus backup capacity at rates likely to be more attractive than what you’ll find later in the spot market when you need them, to leveraging more dynamic contracts that adjust more frequently based on market indices or benchmarks.
If you’re unable to position for long-term performance to begin with because global procurement best practices dictate otherwise, the next best thing is to build the operational flexibility to course correct and adapt before your competitors do as the economy and market evolve and the freight cycle marches on. In this regard, if speed is king, pre-planning is queen. The faster that shippers and carriers alike can identify meaningful market or network signals, understand their potential implications, and take action, the better they are likely to perform as we navigate these unprecedented times ahead of us.
Now on to the April macro update, where all of our primary indicators have returned to their regular reporting cadence after delays from last year’s historic 43-day government shutdown. After a string of mostly constructive months, last month was entirely constructive. Revised Q1 2026 Consumption rebounded moderately to +2.3% Y/Y (down slightly from last month’s preliminary +2.4%), as compared with the prior quarter’s +2.1%, and continued to hold up in the face of ongoing headwinds for the American Consumer. That said, like the prior quarter, most of the strength was in Services, which rose 30 bps to +2.7% Y/Y. Durable Goods consumption finally arrested its descent, rising to +1.1% Y/Y vs. last quarter’s +0.1% Y/Y and the weakest print since Q4 2022. Nondurable Goods slowed 40 bps Q/Q to post a weaker yet still-respectable +1.7% Y/Y.
Given the relatively higher freight intensity required to satisfy the demand for physical Goods, a sustained recovery in Durable and Nondurable Goods consumption would clearly be a bullish signal for future truckload capacity demand. As finished goods inventory is depleted over time, wholesale replenishment orders get triggered more frequently. If sustained, this drives factory orders higher, which then requires increased levels of industrial activity to fulfill those orders and replenish wholesale and retail inventories to satisfy future demand. And US truckload capacity is likely going to be needed to move those goods through just about every link in that chain – even more so if more of that production happens in North America as opposed to overseas. But with Goods consumption instead mostly slowing over the course of 2025, we saw no such signal, and therefore no obvious and immediate forward demand catalyst in sight for the US freight market. But with Q1’s preliminary bounce higher, there could be reason for some early optimism. And while we’ve noted constructive signals in both Industrial Production and the Inventory to Sales Ratio in recent months, both of our truckload capacity demand indicators remain Y/Y deflationary and have yet to converge materially towards the Industrial Production line – though have clearly made some progress recently.
Now with the protagonist of our story, Consumption, continuing to make its case that US Consumers remain mostly resilient and that ongoing relative weakness in Industrial Production was unlikely to last, let’s check in with our proverbial villain – Industrial Production (IP) itself. While our dramatic yet corny ‘Consumption vs. Industrial Production: Which is telling the truth?’ storyline finally got a jolt in 2025 with IP breaking Y/Y inflationary in Q1 at +0.7% after running flat to -1.0% for nine quarters running, it went on to hit +1.7% Y/Y in Q3, stayed there in Q4 but revised to a slightly weaker +1.0% Y/Y for Q1 2026 before bouncing higher in Q2 with a revised +1.4% – now within 900 bps of the Q1 Consumption print. Recall that the entire premise behind the ‘Consumption vs. IP’ storyline was that these two indicators tended to correlate pretty closely historically. Only in rare cases, usually during an NBER recession, have we seen IP diverge materially from Consumption over the last 35 years. And with the observed recovery in IP over the last year, from -0.9% Y/Y in Q4 2024 to +1.4% Y/Y in Q2 2026, we’ve finally just about closed one of the longest periods of divergence in chart history, which means we can finally rule in favor of Consumption in this case as it proved once again to be the more reliable indicator for the overall health of the Consumer and the US economy as a whole.
While we noted last month that, in the spirit of new beginnings and closing out stale storylines, this was one that we would put back on the shelf until the next time such a divergence begins to materialize, we’re going to string this one out for another month or two with both lines still struggling to find their footing. Given the relative weakness in our final Q4 Consumption print at +2.1% Y/Y, we think this is worth continuing to monitor before waving the “all clear” flag on the ongoing resiliency of the US Consumer – which the War in Iran and its impact on inflation (especially at the gas pump) certainly hasn’t helped.
One of the places we’ve also continued to look for more signal is in relative inventory levels, where an accelerating Inventory-to-Sales Ratio is bearish for Industrial Production, and a decelerating ratio tends to be bullish. And just like Industrial Production from 2023-2024, this ratio ran dead flat at 1.37-1.38. But unlike Industrial Production through most of the last year, we didn’t get the same bullish signal in the form of a declining ratio value. Instead, we stayed mostly flat at 1.37-1.38. And flat is where we remained with a final Q4 2025 flashing another ho-hum 1.37. But with Q1 2026 now closing at a materially lower 1.33 and Q2 opening at a lower still 1.31, we’re seeing the first break from trend in over three years. But whether it continues into Q2 or not, we’ll have to wait and see.
As we all know by now, the Inventory-to-Sales ratio historically runs inverse to Industrial Production, which makes sense as bloated inventory levels diminish the need to make more stuff to restock shelves. That means once we finally do observe a local top in the inventory-to-sales ratio, we should expect to see a local bottom in IP – and vice versa. So if a downward trajectory is sustained in the quarters ahead, it would represent an increasingly constructive signal for industrial activity, the demand for TL capacity, and the economy as a whole.
So as noted last month, if Industrial Production was really as constructive as its index suggests over recent quarters, we would have expected to see at least some downward drift in relative inventory levels in the November and December revisions. If we didn’t get any version of that, then the strength of the industrial recovery remained firmly in question until we did – or we’re able to gain more conviction elsewhere. With December coming in flat to November, which was only slightly down from October, leaving Q4 dead flat to Q3 at 1.37, we certainly didn’t get much. But with this month’s 1.31 for Q2 now on the board, it could prove to be just the bullish future demand signal we’ve been waiting for. Again, time will tell.
With recent Consumption, Industrial Production, and relative inventory levels now all starting to show signs of potential recovery to the upside, let’s turn to our primary TL demand indicators – the Cass Shipments Index and the ATA TL Volume Index. As with relative inventory levels, we saw little to get constructive about in 2025. While perhaps the big story last year was IP finally marching higher on a Y/Y basis to once again converge with Consumption, we got the opposite with TL demand as both indicators continue to diverge to the downside from Industrial Production. After closing Q4 2025 at -7.6% Y/Y and its weakest print in over two years, the Cass Shipments Index opened Q1 2026 with an even worse -13.2% Y/Y. But with the February revision up over +10% M/M followed by more strength in March, Q1 closed at -6.2% Y/Y. And with Q2 revising higher to -2.7% Y/Y, this signals a sustained inflection higher towards the inflationary side of the axis to eventually meet Industrial Production. We’re not on the positive side of the x-axis just yet, but have made up significant ground from the Q4 2025 trough.
The ATA TL Volume Index closed Q4 2025 at its lowest print all year at -3.2% Y/Y after closing Q1 at the equilibrium line of 0.0%. But with Q1 2026 opening at a moderately stronger -2.3% Y/Y and revising still higher to close at -1.4% Y/Y, at least this one is now pointed in a more constructive direction. And with the preliminary Q2 mark now on the board at +2.4% Y/Y and it’s first Y/Y inflationary break since Q4 2022, we get our strongest signal yet that TL capacity demand is finally aligning in support of this initial inflationary leg of Cycle 6 Though, if the implied growth in Industrial Production is to be believed going forward, we will have to see a sustained bounce higher in one or both of these indicators to close Q2 – but this most recent print is absolutely a step in that direction.
Now let’s shift our attention to the supply side and Net Class 8 US Tractor Orders, which had spent the entirety of 2025 in Y/Y deflationary territory – even with US TL Spot Linehaul Rate cycle running Y/Y inflationary (albeit only barely). But with Q1 2026 closing at +99.2% Y/Y and Q2 revising to +171.6%, both monsters and the strongest prints since Q2 2021, that has all changed. We noted here in recent months that “going forward, given the net order momentum as well as the rate momentum implied in the market, we expect our Net Class 8 US Tractor Order bars to swing positive in Q1 2026 and finally start to run increasingly inflationary – and back in convergence with the US TL Spot Linehaul rate cycle.” So now with our first glimpse of Q2 now on the board, that’s exactly what we are getting. That said, now it’s going to be all about whether Q2’s early strength holds up through future revisions to signal that historical correlation has returned before getting too excited one way or another. So far, so good though.
While Net Class 8 Tractor Orders have bounced around over the last three or four years, the roller coaster in US retail diesel prices over the same period has been arguably even more impactful to US TL market dynamics. And with a prolonged War in Iran still keeping energy prices spiking higher for the last 2-4 months but now poised to collapse lower, diesel is back in the spotlight. After bottoming out at $2.40/gal in 2020 during early COVID, prices surged 140% higher to a peak of $5.75/gal in 2022 following Russia’s invasion of Ukraine. From there, we corrected -30% lower to $3.90 by mid-2023 followed by another -10% drop to $3.52/gal by the end of 2024. Since then, the market had oscillated + 5.0% from month-to-month to reach $3.72/gal in Feb 2026 – up +5.7% vs. January and reversing a slide of -7.8% from November. Since then though, with global energy prices still soaring with the effective closure of the Strait of Hormuz, June MTD diesel now sits at $5.206/gal – +$1.684 higher vs. January, or +48%.
As noted in past issues and repeated here for any new readers, the last time we saw anything like 2022’s spike in fuel prices (which peaked at +75.1% Y/Y in June ), and now 2026’s (currently +60.8% Y/Y in May) was in 2008 when diesel climbed to +66.6% Y/Y that June – in the throes of The Great Recession. During that particular US TL Spot Linehaul Rate Cycle, unlike this one, diesel spiked higher several quarters ahead of spot and contract rates. As a result, we saw an unprecedented wave of motor carrier bankruptcies and exits as profitability was violently wiped out – especially for those most exposed to the spot market. The key difference in 2022 is that spot and contract rates led diesel by several quarters, which allowed the market to absorb the diesel shock without forcing carriers out of the market in material numbers at the same rate. And so far at least, it has been a much more gradual exit. As the battle between spot market rates and carrier operating costs rages on, the role that diesel prices have played has been in helping to set the ultimate market bottom where our Y/Y US TL Linehaul Spot Index line finally inflected higher as sufficient surplus capacity has been forced to exit as their operating margins evaporate. And as noted here, we believe we found that bottom with the confirmation of Q1 2023 as our deflationary inflection point. Going forward, diesel’s role remains that of a pacesetter.
So here we sit with a revised Q2 2026 print on US TL spot linehaul rates at +33.9% Y/Y and the eighth consecutive inflationary mark in a row. Consumption is still flashing mostly positive signals while Industrial Production and Relative Inventory levels show promising signs of finally breaking out of prior patterns to more constructive upside trajectories. So what’s going to move the needle on Spot TL rates one way or the other in the month ahead? As we’ve noted since the April 2025 issue, “with the haymaker of an announcement on Liberation Day April 2nd of incremental tariffs on every country that imports into the US, trade policy now takes center stage as the leading catalyst for where both the trucking market and the broader US economy go from here.” And that remained the case through early Q4 last year.
Then three months ago, pole position went to the rate of supply exits from new regulatory pressures on non-compliant CDL/immigration/EPL drivers and the carriers that employ them. Since then, the Supreme Court rendered the tariffs levied under presidential IEEPA power illegal, which the Trump White House immediately followed up with a 6-month counter-measure under Section 122 of the Trade Act of 1974 taking most of the previous levies to the 15% maximum. This will stand through July, at which time whatever comes from the raft of Section 301 investigations kicked off in the meantime would potentially take their place. That said, importers have had a relatively brief 6-month period of tariff stability to confidently pull forward any imports previously paused during the post-Liberation Day US Trade War circus. If this surges imports and therefore inland freight flows like we saw in Q1 2025, that would create a welcome bump in TL capacity demand – even if only temporary. Though, as we stand here in late June, we haven’t seen this one materialize at all.
And of course, the Supreme Court entered the chat once again last month with its unanimous ruling in Montgomery vs. Caribe Transport that the Federal Aviation Administration Act (FAAAA) does not in fact preempt state law claims against freight brokers for the negligent hiring of motor carriers. As we unpacked at the top, it is possible that the near-term market response as precedents are eventually set in cases currently being litigated, could create additional inflationary pressure on spot and contract linehaul rates. But as potentially impactful as that would be, we believe the potential resolution of the War in Iran and the correction lower in diesel prices is the more powerful short-term market force in the months ahead. So, lots of movement on the podium again this month. Let’s run them down, in order of expected potential impact:
1. Diesel Prices: As noted in past issues, now that we’re well into our inflationary break higher in the Y/Y US TL Spot Linehaul rate cycle, we believe that diesel prices in the months ahead will help set the pace at which spot market rates continue to recover from here. As it stands, prices have popped +$1.48/gal or +40% higher over the last three months to the current June 2026 MTD mark of $5.206/mi. Prior to last month, you have to go back to June 2022 to find a higher monthly average. As long as this mostly inflationary trajectory continued, we would expect to see the rate of supply exit accelerate – even with the recent move higher in spot linehaul rates since December. But as we outlined at the top, we now believe that a rapid decline in diesel prices could set off a wave of contract re-pricing to address an increasingly negative divergence between all-in contract and spot rates.
2. Increased Broker Liability without the FAAAA SCOTUS ruling: If a material segment of the motor carrier supply base is suddenly rendered ineligible due to a Conditional safety rating or some other combination of risk factors, as carrier vetting protocols are presumably hardened in response to increased broker (and shipper?) liability, that could accelerate spot linehaul rates higher as a result. That outcome is far from certain, however, as all market participants are forced to now adapt to materially different risk vs. reward scenarios is a rapidly rising spot market rate environment.
3. Non-Compliant CDL/Immigration/EPL Driver Crackdown: We believe that the increasing scrutiny on non-EPL or CDL-compliant drivers will accelerate the exit of non-conforming drivers and fleets that currently employ them, and could represent the most meaningful supply-side catalyst in the last ten years as market labor policies evolved in response to the relentless (and wrong) driver shortage narrative. This is a big deal, and could finally explain one of the driving forces behind both the magnitude and the duration of the 2022-2025 freight recession. If the $1.50/mile marginal carrier (i.e. can still run profitably given lower relative labor costs) has left the market and isn’t coming back, should we then expect the market rate floor to rise to the breakeven point of the next cheapest (and DOT/FMCSA-compliant) carrier at +$1.90/mile? That certainly sounds like a logical outcome to all of this, but we’ll have to wait another few months or so as stricter FMCSA policies become law and new legislation makes its way through the House and the Senate before we get more clarity.
4. TL-Intensive US Consumer Spending: Consumer spending (as a proxy for future TL capacity demand), also somewhat of a derivative of the tariff wild card but we’ll keep separate for now, bumps back down a notch or two given the action in diesel, regulatory scrutiny, and the SCOTUS IEEPA ruling. Conditions remain tough to say the least for the average US Consumer, despite ample signal that peak Consumer Price Inflation (CPI) is well behind us after many months of slow yet uneven sequential decline. After correcting all the way from June 2022’s +9.1% Y/Y to June 2024’s +3.0% Y/Y, we had continued to fade mostly lower as prices stabilized. But with May’s print now on the board at an increasingly hot +4.2% Y/Y, based primarily on rising energy costs including gasoline, the Consumer can’t seem to catch a break. But so far at least, despite a festering affordability crisis and weakness in the labor market, US Consumers continue to consume. And so long as that remains the case, the US economy remains on a stable footing.
5. Global Trade War/Tariffs Impacts: With the Trump administration’s wildly volatile tariff actions as part of an escalating trade war between the US and the rest of the world, the longer that tariff-based trade barriers remain raised, the more destructive the mid and long-term impacts are likely to be. But so far at least, while TL capacity demand certainly appears to have been stunted over most of 2025 as a result of these actions, consumer inflation has not run wildly out of control and the economy has not tipped towards recession. If Consumption levels are able to hold on to the strength they have shown through the most recent quarter, then spot truckload rates will likely continue to bend higher on the back of an increasingly depleted supply base and a softening of trade barriers as more deals are struck. Though with a SCOTUS ruling on the legality of the IEEPA-backed tariff actions now on the board, hopefully there is a light at the end of the tunnel with regard to stability and predictability. And as we mentioned earlier, while it hasn’t happened yet it remains possible that we could get a short-term surge in import volume over the next few months that remain of Section 122 enforcement
With the prior cycle still firmly in the rearview mirror, we can look back and reflect a bit despite the increasingly uncertain path in front of us. While the deflationary leg indeed took us far lower than those that came before (-31.8% Y/Y vs. last cycle’s -19.0%), it also took us two quarters longer than the seven-quarter deflationary leg of the last cycle (Q4 2018-Q2 2020) and the seven-quarter deflationary leg of the cycle before that (Q3 2015-Q1 2017). So, incredibly challenging market conditions for sure for most of those on the supply side, but hardly ‘unprecedented’ or ‘generational’ in nature – even considering the lower low and the longer duration. And if this cycle was more like past cycles than it was different, we should be able to anticipate typical market behavior as this Y/Y deflationary leg slowly but surely came to a close and the Y/Y inflationary leg of the new cycle began – and then recommend how best to position. So as outlined in recent issues and revised here for all of you first-time readers, we recommend some version of the following for both supply-siders and demand-siders as we start to accelerate out of the gates of this new cycle.
For motor carriers and brokers operating on the supply side of the market, this likely means keep doing what you’ve been doing over the last year and a half – at least if that means cutting costs, getting leaner, and conditioning your teams to be able to do more with less. While we absolutely see the light at the end of the tunnel with some version of a recovery in spot TL linehaul rates already in motion, the market correction is virtually guaranteed to be uneven – with different industries, geographies, and equipment types all evolving at their own pace. We see you, Flatbed market! Also, as noted last month, while the rate of recovery can look pretty dramatic on our Y/Y cycle charts, the sequential development of the market rates each of us experiences will feel altogether different. For example, even if spot rates found a way to go on to close Y/Y inflationary in Q4 2026 at +60% Y/Y, that only represents a +29% increase from current June 2026 levels – which means we’re basically already halfway there.
And with the Q1 2025 TL Contract Linehaul (Cass) Index breaking Y/Y inflationary at +1.4% Y/Y for the first time since Q4 2022, Q1 2026 notching higher to +2.4%, and now a revised Q2 coming in at a blistering +6.2%, its trajectory from here is looking more and more certain as well. But regardless of the ultimate pace at which the market trends Y/Y inflationary over the quarters ahead, there is little downside in remaining disciplined and pursuing operational excellence in whatever it is that you do – especially now that conditions have gotten a lot more challenging with spiking diesel costs. As you prepare for the balance of 2026, the months ahead represent a welcome opportunity to refine your commercial strategy and carefully consider the shippers that you want to partner with going forward into the next cycle. So hopefully you are choosing wisely, as those who navigate the cycle most successfully over the long run tend to be the ones with the most durable long-term commercial relationships with partners that have earned their trust through both the ups and the downs.
And for shippers on the demand side of the marketplace (and brokers that operate on both sides), our guidance is similar. While the most recent Y/Y deflationary leg of the cycle has technically ended, the months ahead represent a tremendous opportunity to recalibrate your transportation strategy for the Y/Y inflationary leg that had just begun pre-trade war. The race to the bottom of the TL market that you have enjoyed up to this point is mostly over, but its lingering impact is almost certainly masking weaknesses and deficiencies that will take a toll this year if left unaddressed. So now is the time to examine your current and projected freight flows to understand where alternative modes, operating models, and capacity partners could create a comparative advantage – whether it be from cost, speed, utilization, or flexibility – in an inflationary TL market or one made all the more volatile with evolving trade conditions. With the cost of capacity increasingly on the rise, the penalty for waste only increases from here. So, focus on filling your trailers and intermodal boxes, or find a way to only pay for the space you need (the cost for shipping air is likely going up, not down!). And work to eradicate empty miles and excessive dwell times from your networks. Remember that 2026’s winners will be determined by the actions taken now. Aspire to be considered a ‘Shipper of Choice’ throughout the cycle, not just when the financial pressures of an inflationary rate environment force your hand.
We continue to forecast contract linehaul rates, after breaking Y/Y inflationary in Q1 2025, to run higher into 2026 as primary tender acceptance rates deteriorate, routing guides spring leaks, and freight contracts are reset through a flurry of mini-bids – just like in 2017 and 2020. Though we now expect this to get accelerated even further as diesel prices correct materially lower in the weeks and months ahead, thus making all-in contract rates much less attractive as compared to the spot market. Regardless, we hope that this time around, the industry and its trading partners will have more effective tools at their disposal to make better use of the capacity that already exists in the market (across all modes) such that the supply side won’t be baited into overshooting to the same degree as in cycles past. And that the dramatic volatility of this market can begin to be tamed such that we’re not all doomed to a future defined by higher peaks and lower troughs.
But until then, the roller coaster must unfortunately continue. Remember, “it’s the Cycle, stupid!” The market cycle itself, powered by the supply vs. demand forces that have shaped it for the last +20 years, is what will take US TL Spot Linehaul rates +30% higher between now and the end of the year. And so long as the trucking market continues to remain as fragmented and as largely unregulated as it has been since 1980 (this is a good thing!), with low barriers to entry and exit (and likely trending lower with the digital transformation of the spot market), the Cycle persists. And so long as the Cycle persists, the most successful market actors over the long-term, regardless of what side of the market they operate on (buy-side vs. sell-side), accept the apparent but directionally predictable chaos of the truckload market rate environment with stoic indifference. Control what you can control, and go with the flow. Whatever it is, this too shall pass. Onward from here.